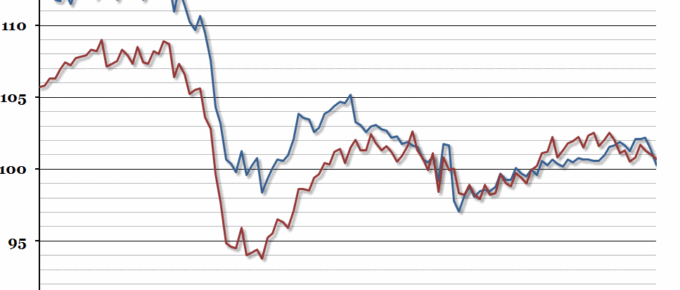
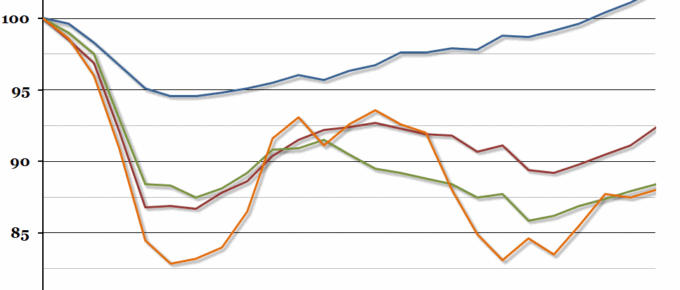
This morning the UK’s production index for the end of 2015 was released, and it showed that the poor end to the year left the UK’s production sector, and in particular manufacturing, smaller than at the end of 2014.
Chart of the Week: Week 22, 2015: UK GDP Growth by Sector
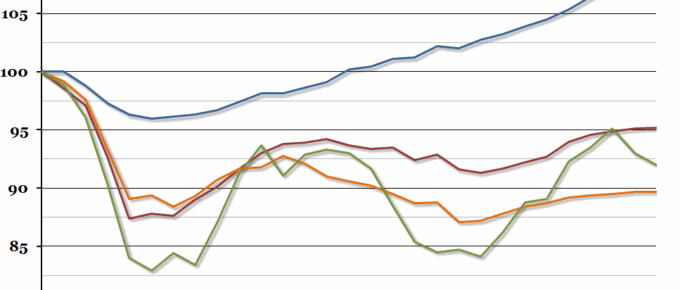
Contrary to most economists’ expectations, the overall growth rate in the first quarter of this year remained unchanged last week, at a disappointing 0.3% (most people had expected it to be revised upwards).
Chart of the Week: Week 6, 2015: UK Production Index
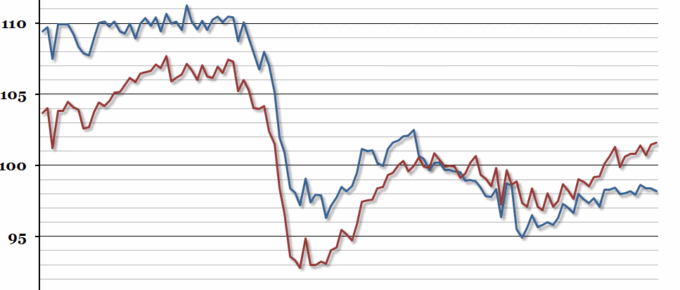
Yesterday, the Office for National Statistics released the index of the output for the production industries in December 2014.
Chart of the Week: Week 47, 2014: Profitability of UK Companies
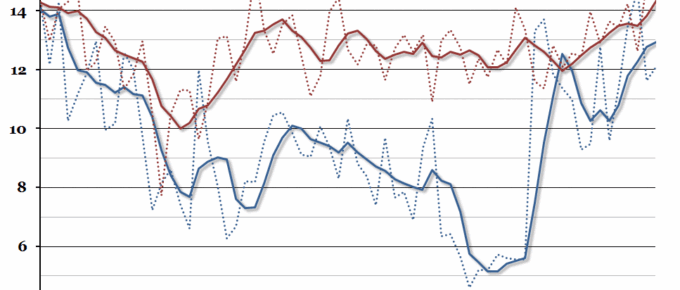
The non-financial services sector set a new record for profitability in the second quarter of 2014, continuing the strong services recovery since 2011.
Chart of the Week: Week 40, 2014: Effective Exchange Rate
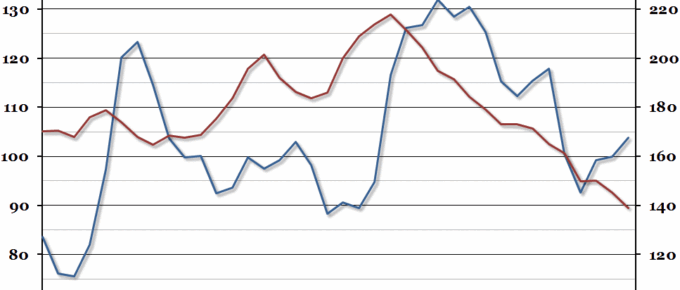
The decade leading up to the 2008 financial crisis was characterised by a very high real effective exchange rate, but also a period of serious decline for the UK manufacturing sector.
Chart of the Week: Week 22, 2014: UK GDP Growth by Sector
When the second estimate of Q1 GDP was released at the end of last week, the preliminary growth rate of 0.8% remained unchanged.

