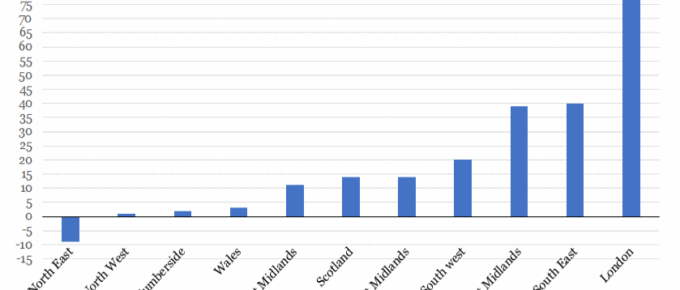
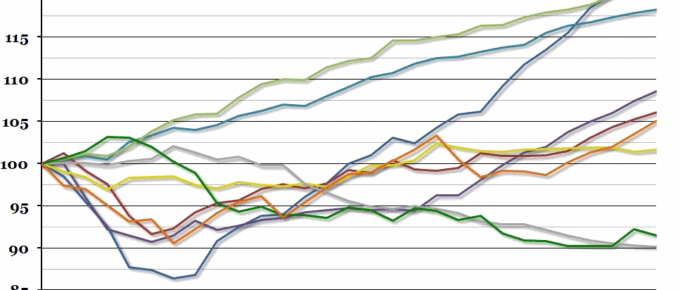
This chart shows that London house price growth over the last decade has far outstripped all other regions in the UK, with areas of staggering growth such as Hackney, which rose 120%.
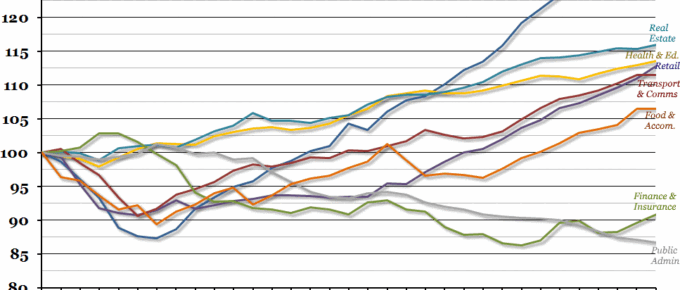
Chart of the Week: Week 27, 2016: UK Services Growth by Industry
The services sector is crucial to the UK economy. In the first quarter of 2016, it was only growth in that sector which kept overall economic growth positive, with the production industries in recession.
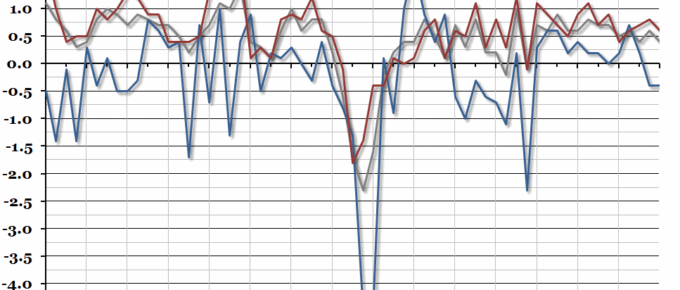
Chart of the Week: Week 17, 2016: GDP Growth by Sector
The preliminary estimate of first quarter GDP growth was released this morning, and it showed that growth had slowed at the beginning of this year to 0.4% (from 0.6% at the end of 2015).
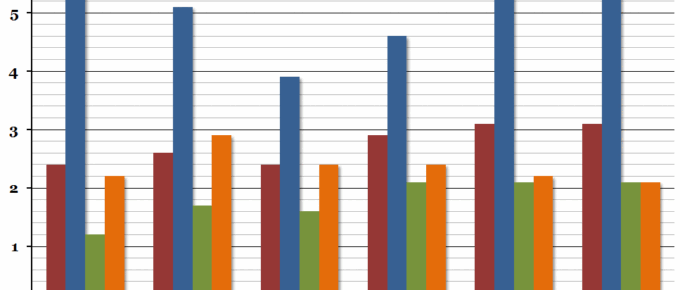
Chart of the Week: Week 4, 2016: Projected GDP Growth
Tomorrow morning, the preliminary estimate for UK fourth quarter GDP growth will be announced, and we’ll get a first impression of annual growth for 2015.
Chart of the Week: Week 32, 2015: UK Real Earnings Growth
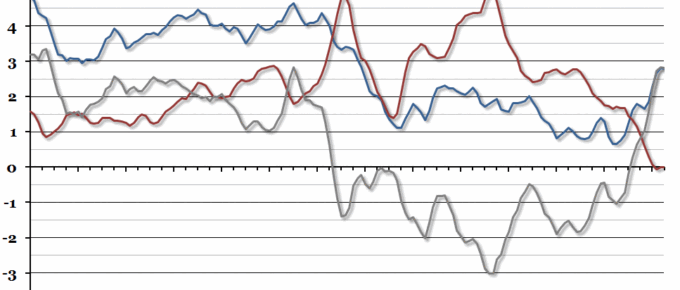
The labour market statistics released this morning showed regular average earnings (excluding bonuses) growing by 2.8% in the second quarter of the year (compared to Q2 2014).
Chart of the Week: Week 25, 2015: UK Services Growth by Sector
A few weeks ago, we produced a chart which showed how the UK service sector is outperforming other sectors and dragging GDP growth up.

