Economic Research Council Master Committee William de Laszlo is an advisor to three family offices on their UK and European investment strategies whilst also exploring opportunities in social and charitable ventures. Prior to this William spent five years at Rcapital, a London-based private investment business, focusing on deal origination and transaction strategies. Working alongside the […]
Latest Blogposts
Edward Holloway
Memories of Edward Holloway (1906-1985) by Jim Bourlet Edward Holloway was my predecessor as Hon Secretary of the Economic Research Council a position he held from 1954 to 1985 when he unexpectedly died at the age of 79. He had been a founder member of the Economic Reform Club (the original name for the embryo […]
ERC Research Paper 11
ERC Research Papers The New Economics of Energy Security Published July 2006By Sir Bernard Ingham, Professor Colin Robinson and Dr Eileen Marshall CBEForeword by Professor Tim Congdon CBE As covered in The Business newspaper here, written about by the authors Robinson and Marshall in the Wall Street Journal 12th July “Energy Insecurity”, and blogged on […]
ERC Research Paper 10
ERC Research Papers Cost Effective Defence Published October 2006By Lewis Page Britain’s military is in crisis; under-equipped, undermanned, undersupplied and severely overstretched. Spending is not matching aspirations and there is an emerging consensus that this must be addressed. But what is the most intelligent way to apportion those funds in terms of costs versus capabilities? […]
Chart of the Week: Week 15, 2017: UK Voter Sentiment on Key Issues
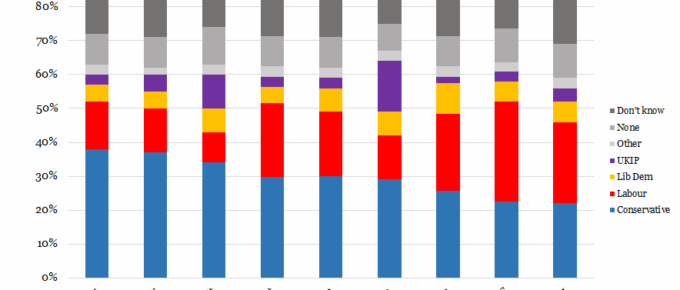
The chart shows that the Conservative Party enjoys the majority of support across 7 of 9 issues, with Labour support exceeding the Tories’ only on NHS and Housing.
Chart of the Week: Week 14, 2017: Trends in Take-Home Pay
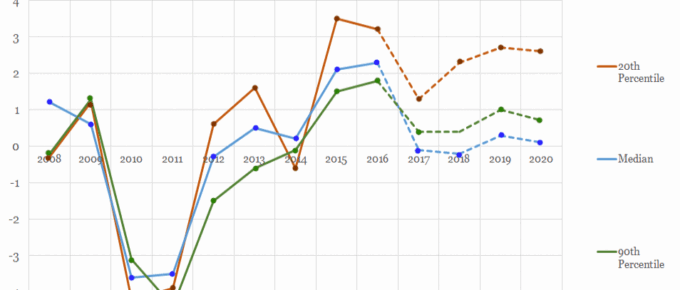
The chart shows that take home wages for the 2nd and 9th decile of earners have been strongly correlated in the years since the financial crisis.


