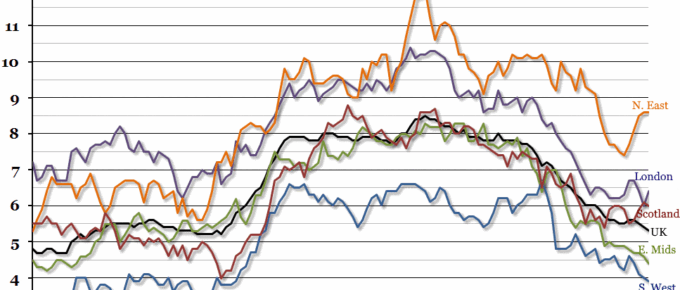
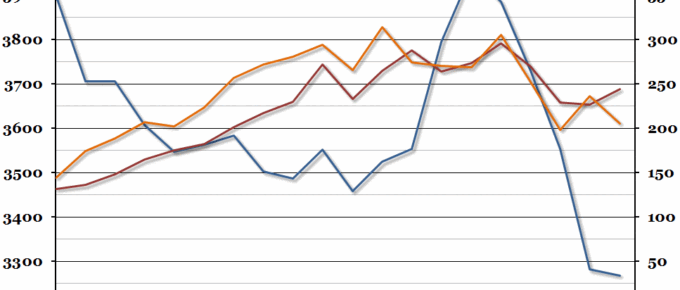
After a brief stutter last quarter, the UK’s headline unemployment rate continued to fall in the third quarter of the year, to 5.3% (the lowest it has been since the beginning of 2008, when it stayed at 5.2% for around six months).
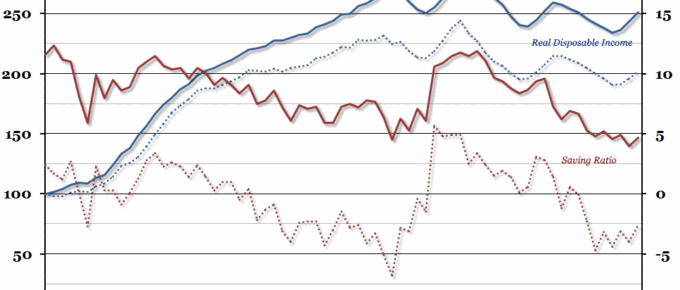
Chart of the Week: Week 44, 2015: UK Household Finances
On Monday, the Office for National Statistics issued a revised measure of both real household disposable income and the household saving ratio, which made them seem worse than previously thought.
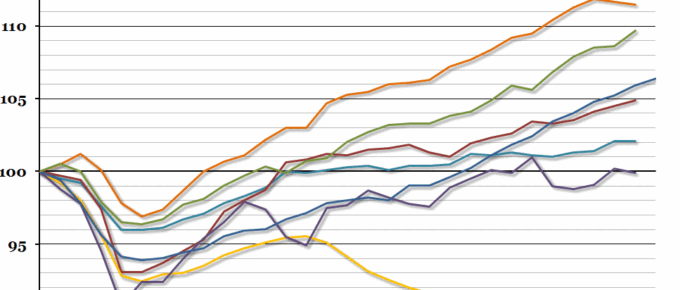
Chart of the Week: Week 43, 2015: International Post-Recession Recovery
Preliminary figures released by the Office for National Statistics yesterday suggested that UK GDP growth in the third quarter of the year was 0.5% – lower than the previous quarter’s growth rate of 0.7%, and the consensus forecast of 0.6%.
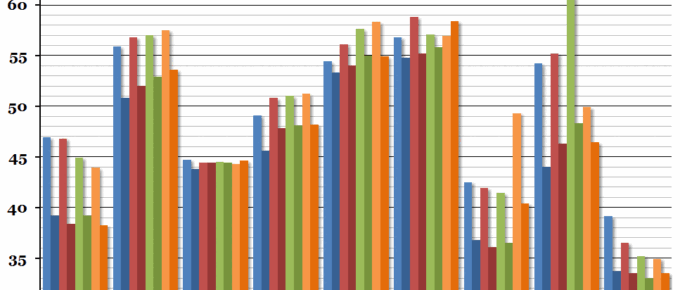
Chart of the Week: Week 42, 2015: EU Government Finances
Eurostat announced their updated statistics for European government finances this morning, and the headline figure showed that across the EU, the average deficit improved from 3.3% to 3%.
Chart of the Week: Week 41, 2015: Historical Real Average Salary
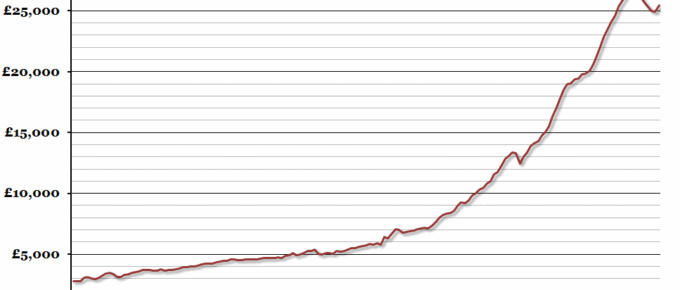
According to data released this morning, earnings growth remained strong in the three months to August at 2.8% in nominal terms.
Chart of the Week: Week 40, 2015: UK Workless Households
The annual study from the ONS on workless households in the UK was released yesterday, and it showed a mixed picture with total workless households continuing to fall but the number of households where nobody has ever worked growing.

