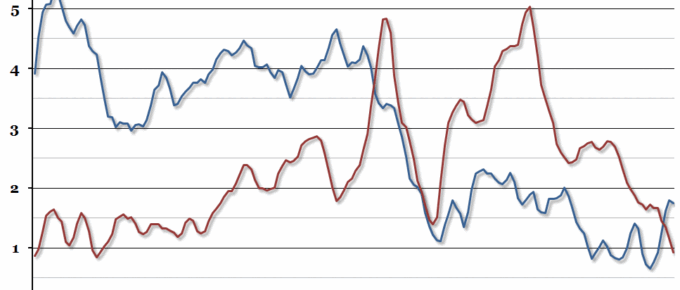
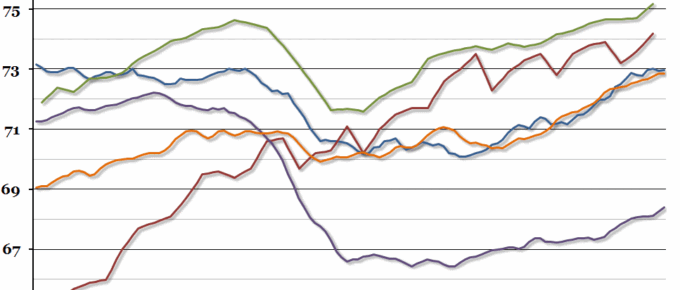
This week we’ve received two big bits of economic news: CPI inflation fell to just 0.3% in January, while earnings growth remained roughly steady at 1.7% in the three months to December.
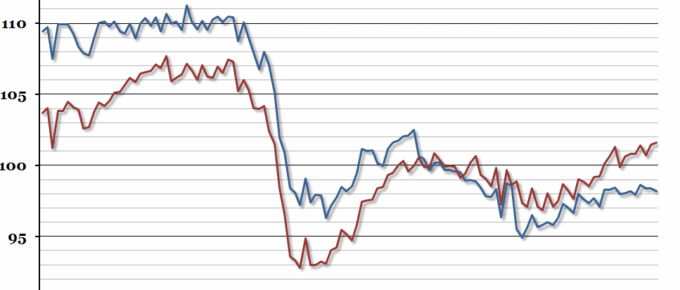
Chart of the Week: Week 6, 2015: UK Production Index
Yesterday, the Office for National Statistics released the index of the output for the production industries in December 2014.
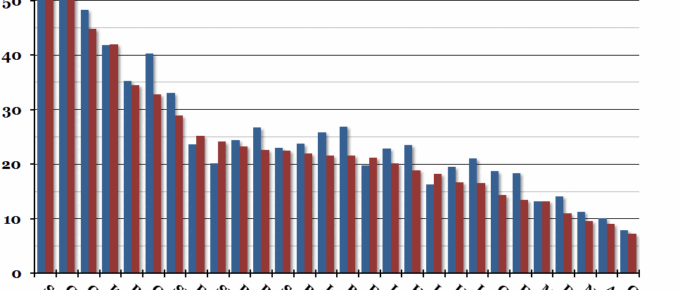
Chart of the Week: Week 5, 2015: EU Youth Unemployment
European unemployment figures for December 2014 were released at the end of last week, and both the headline figure and youth unemployment were down compared to the end of 2013 (unemployment was down from 10.6% to 9.9% and youth unemployment was down from 23.1% to 21.4%).
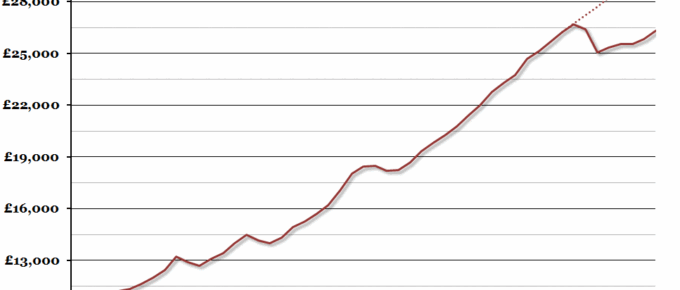
Chart of the Week: Week 4, 2015: UK GDP Per Capita
Preliminary growth figures for the final quarter of last year were released yesterday, and although quarterly growth slowed down to 0.5%, 2014 was still the best year of growth since 2007 with an annual rate of 2.6%.
January 2015
A view of the world must include a reference to the Ukraine. This unholy mess is potentially a major headwind for European stability and it is difficult to see how it can be resolved. Hopefully at the least it can be contained and possible discussions that are scheduled …
Chart of the Week: Week 3, 2015: Full Employment
David Cameron set out his aims for “full employment” this week, defining it as having a higher employment rate than other developed economies.

