Summary
This week, we delve into the impact of changes in the price of different energy-intensity goods and services on the 12-month CPI inflation rate in the UK, illustrating the growing effect of energy-intensive components on inflation rates.
What does the chart show?
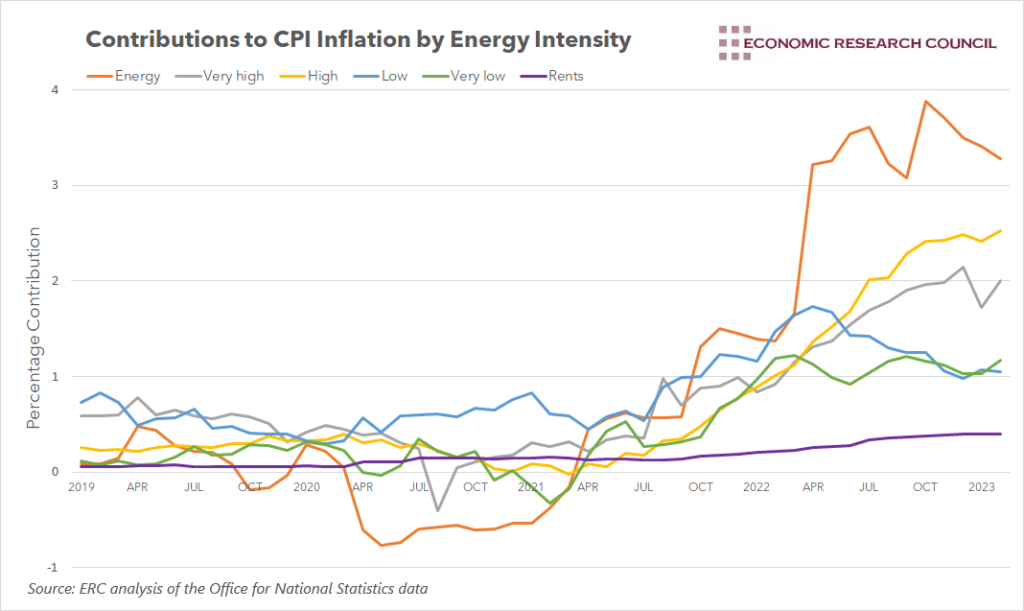
The chart provides a comprehensive illustration of the contribution to the UK’s Consumer Price Index (CPI) inflation from goods and services with varying energy intensities.
The ‘Energy’ line on the chart reflects the direct effects of changes in energy prices on CPI inflation, specifically accounting for the gas, electricity, liquid fuels, and fuels and lubricants components.
In addition to the direct effects, the chart further categorizes the other components of the CPI into Very High, High, Low, and Very Low energy intensity categories based on their exposure to energy prices. These categories demonstrate the extent to which energy prices indirectly influence the production processes of various goods and services within the economy, thus affecting their contribution to the overall CPI inflation.
The chart reveals several interesting trends in the data. Throughout 2019, a relatively small range existed in the impact each energy intensity group had on CPI, with this range not exceeding 1%. This suggests that during this period, the differences in energy intensity among various goods and services had limited influence on inflation.
However, the chart also captures the notable shift that occurred during the start of the pandemic, when the impact of energy prices on CPI turned negative and remained so through 2020.
From 2021 onwards, the chart shows a marked increase in the impact each category has on CPI, with the range between each category expanding significantly. The higher energy intensity components demonstrate the fastest increase in their contribution to CPI inflation. This trend underscores the growing importance of energy prices in shaping inflation dynamics in the UK economy.
it is worth noting that the chart separates rents as a distinct category. While rents have low exposure to energy prices, they have nonetheless contributed an increasing amount to CPI inflation, particularly since 2022.
Why is the chart interesting?
The chart demonstrates that the pass-through effects of energy price changes are not uniform across all energy intensity categories. Goods and services with Very High and High energy intensity show a much stronger response to energy price movements, while those with Low and Very Low energy intensity exhibit a more muted response. This disparity can be attributed to the fact that businesses with higher energy intensity rely more heavily on energy inputs for their production processes. As a result, when energy prices rise, these businesses face greater cost pressures, which are often passed on to consumers in the form of higher prices. Nevertheless, it is important to note that even goods and services with lower energy intensity can experience increased production costs due to higher energy prices, as energy costs can indirectly impact various stages of the production process.
The varying pass-through effects have significant implications for the overall inflation dynamics within the economy. In periods of stable energy prices, the impact of energy intensity on inflation may be relatively subdued, as the chart illustrates in the pre-pandemic period. However, when energy prices experience significant fluctuations, the contribution of Very High and High energy intensity components to inflation can become more pronounced, potentially amplifying the overall inflationary pressure within the economy. This amplified impact is evident in our chart analysis, which shows a significant increase in the contributions of Very High and High energy intensity components to inflation during periods of energy price volatility, such as the recent surge in energy prices following the Russian invasion of Ukraine.
The ongoing surge in inflation has been fuelled by several factors, including rising energy prices, which have had a disproportionate impact on industries with higher energy intensity. Businesses in these sectors are facing increased production costs as energy prices have climbed, putting pressure on their profitability and competitiveness. However, this challenging environment also offers an opportunity for these companies to reassess their energy consumption and explore innovative solutions that can help them navigate these turbulent times.
By investing in energy-efficient technologies and processes, businesses in high and very high-energy-intensity sectors can reduce their dependence on increasingly expensive energy sources, thereby lowering their overall production costs. Not only can this help these companies maintain or improve their competitiveness in the face of rising energy prices, but it can also contribute to a more sustainable, low-carbon economy, whilst easing inflationary pressure.
As we look to the future, the dynamics between energy prices and inflation will remain a critical aspect of economic analysis and policy formulation. The current environment of high energy prices and inflationary pressures presents a unique opportunity for businesses to adapt, innovate, and strengthen their competitive edge.


