Thursday saw the announcement of a whopping 54% increase in the energy price cap, a figure that’ll leave many choosing between heating their home and feeding their children once it comes into force in April. In response, a number of measures were announced by the Chancellor to help to ease the blow for households. This week, we present a series of charts to examine the price cap, the measures put in place, and what they mean for households.

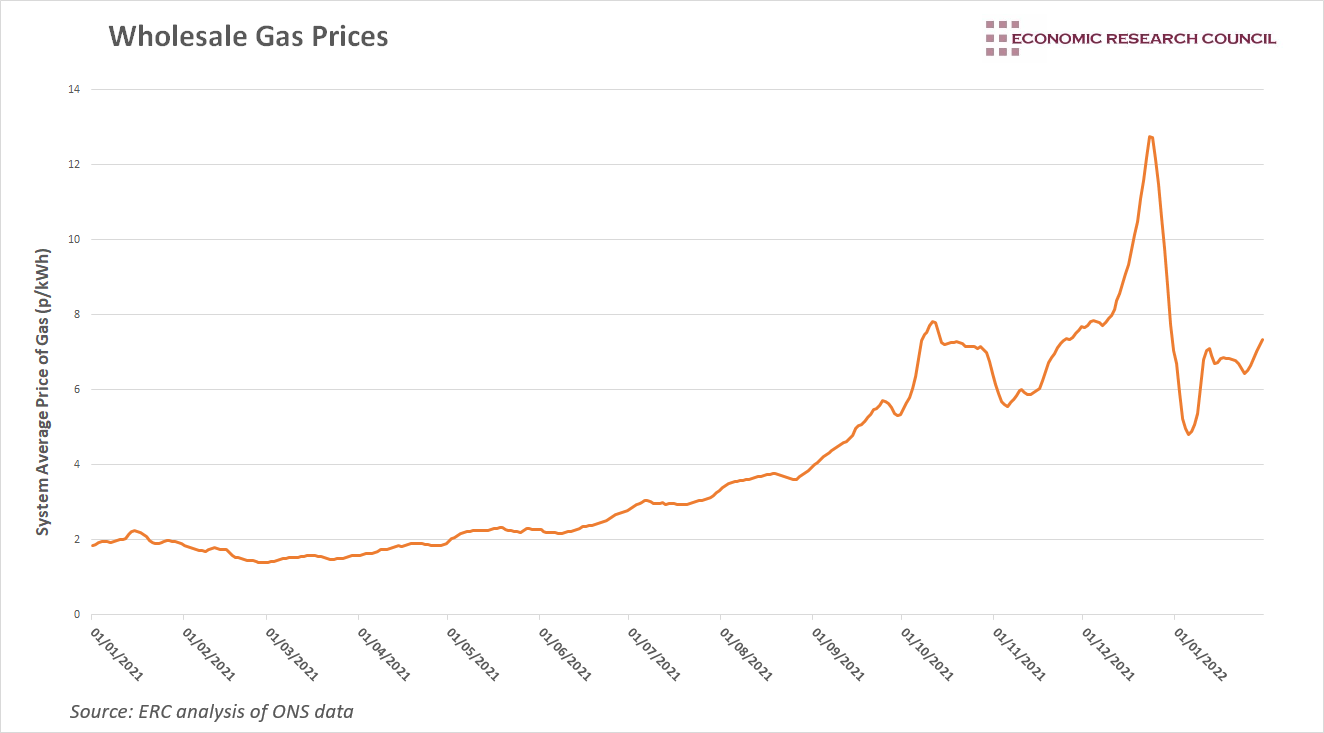
The chart above shows the 7-day rolling average of the System Average Price of gas in the UK in pence per kilowatt-hour, which represents the average price of all gas traded, excluding futures contracts. This has been the fundamental determinant in the rise in energy prices we are currently experiencing, as energy suppliers push costs onto consumers. For more information on why gas prices have been on the rise in the 2nd half of 2021, please see our ‘Wholesale Gas Prices’ chart.

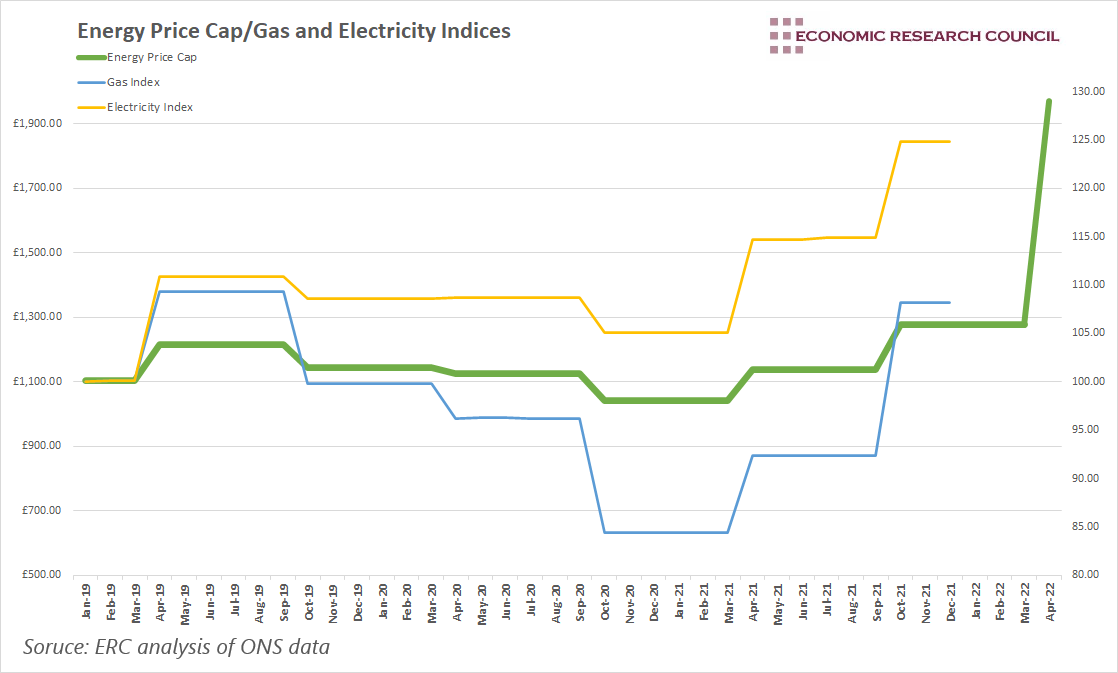
The energy price cap limits the rates suppliers can charge for their default tariff. It does not apply to those on fixed-term energy tariffs, or other green energy tariffs that are exempt. Around 22 million homes are affected by the cap. The cap was introduced in 2019 with the aim of ensuring that people, especially those who don’t switch supplier, do not pay too much for their energy. It is important to understand that the cap is not a limit on the value of a bill that can be paid. Instead, it limits the standard charge and price per kilowatt-hour that suppliers can charge. As such, it is presented as the average yearly bill. The chart above reflects this. The thicker green line represents the energy price cap, whilst the blue and yellow lines represent the index of gas and electricity prices respectively and are read from the right-hand axis.
The energy price cap has fluctuated since its inception, with the largest increase prior to October 2021 being the first change in the price cap, which increased the cap by over 10%. The scale of Thursday’s 54% rise is clear to see, dwarfing any single increase previously experienced. Whilst the 54% increase in the cap is sure to push families into precarious situations, it is worth noting what has come before, and the cumulative effect this will have. When the latest change comes into effect, the cap would have risen three consecutive times, and increased by nearly 90% due to those rises over the period of a year. The latest year on year wage growth figures show a growth rate of 4.2 per cent. It is therefore understandable that people have called for government assistance.
Wholesale prices of gas and electricity play a crucial role in determining energy bills. Subsequently, Ofgem uses these to set the cap. April’s price cap has been determined using wholesale prices between August and January, which saw extremely high prices for gas as shown above. The concern is that if wholesale prices remain high between February and July, we may well see another significant rise in the price cap in October.
The chart also shows that changes in gas and electricity prices are significantly correlated to changes in the energy price cap. In fact, between March and October 2021 when the energy price cap increased by 23%, the price of gas and electricity increased by 28% and 19% respectively. As such, we can expect to see a significant increase in gas and electricity prices in April, close to the 54% rise in the price cap.

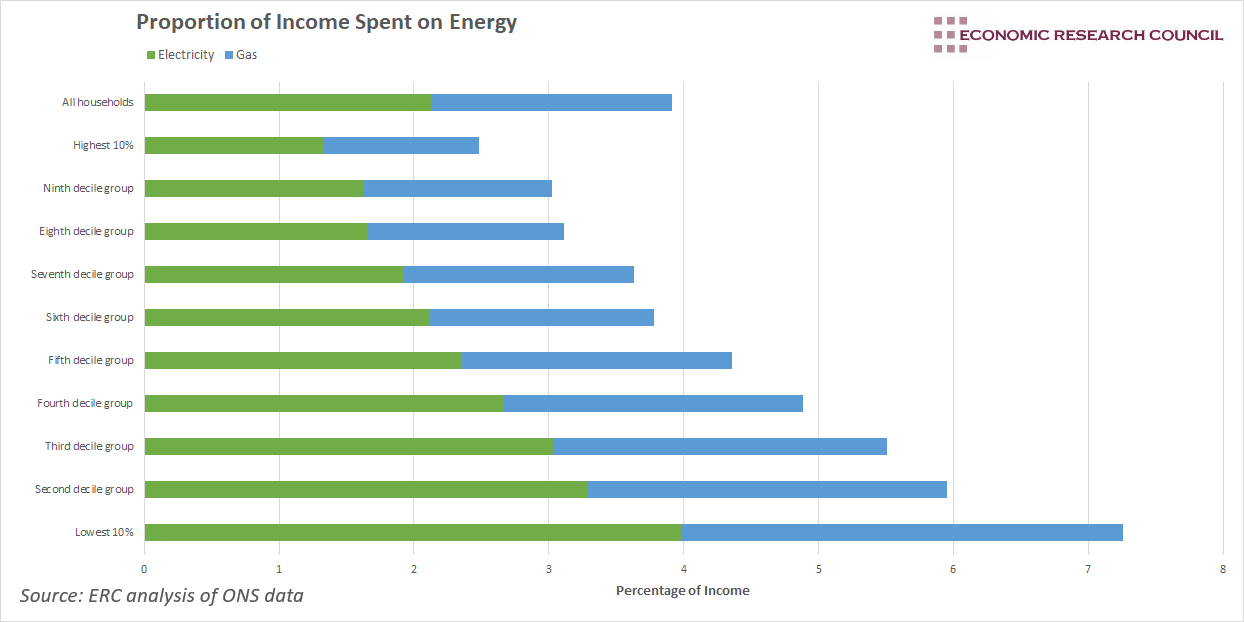
The chart above shows the percentage of disposable income that each income decile spent on gas and electricity in 2020. Lower-income households tend to spend a greater proportion of their income on energy. As we have already experienced a 23% increase in the energy price cap last year, which is way above the rate of inflation, it is likely that each decile is spending a greater proportion of income on energy, with the poorest households having the largest increase. A 54% increase in the energy price cap may mean the poorest households will end up spending over 10% of disposable income on gas and electricity alone.
Within minutes of the increase in the energy price cap being announced, the Chancellor was at the dispatch box, explaining measures that would soften the blow for the 22m affected households. Each household in band A-D will receive a £150 council tax rebate this April. In addition to this, all households will receive £200 off their bills in October, but this will need to be paid back in instalments of £40 over the next 5 years. A discretionary fund will be set up to allow local authorities to make payments worth £150m to assist those on lower incomes that fall through the net, and eligibility for the Warm Home Discount will be expanded.
Targeting council tax seems appropriate as energy is a household bill, and council tax is a useful way to target households directly. However, there may be many affluent people living in Band D housing, particularly in London. Nevertheless, the government have been clear in explaining they are not simply trying to target the most vulnerable with this policy.
The strongest criticism levied at the £200 rebate is that it simply acts as a loan. Families will need to pay it back over the course of 5 years. As we have seen above, there is every possibility that wholesale prices continue to rise in the coming months, which will lead to a further rise in the energy price cap in October. Adding £40 to rising energy bills will be completely unfeasible for some families, meaning the government may need to revisit this policy in the coming months.
Both policies are actually favourable for lower energy users as they will account for a larger proportion of the increase in their energy bills compared to higher users. These people are also likely to live in poorer households, making the policy somewhat progressive. The only problem is that the sum eventually needs to be paid back, potentially at a time when people really feel the sting in their pockets.
Some had discussed the possibility of cutting VAT on domestic fuel bills as a means of addressing the problem. VAT on domestic fuel bills is currently charged at 5%. For the average user, scrapping VAT would have reduced their bills by £98.55, below the level of assistance provided by either of the policies mentioned above.
The policies laid out by the Chancellor were much needed, however, the aim is not to protect against price rises. Rishi Sunak has been very clear that he believes we need to get used to higher energy prices. The measures put in place on Thursday simply serve to smooth the blow. Nevertheless, they also appear hopeful that market forces will reduce wholesale prices, enabling energy prices to fall. If this does not occur, the Chancellor will have some serious decisions to make before October.
By David Dike

