Summary
The rate of inflation fell from 2.5% to the government’s target of 2% in July. Despite this, analysis of contributing categories, as well as monthly changes in inflation suggest there is still some way to go in tackling inflationary pressure. Some categories where average prices have fallen are subject to short term fluctuations. At the same time, where average prices have risen, they have done so at a faster rate than in recent months.
What does the chart show?
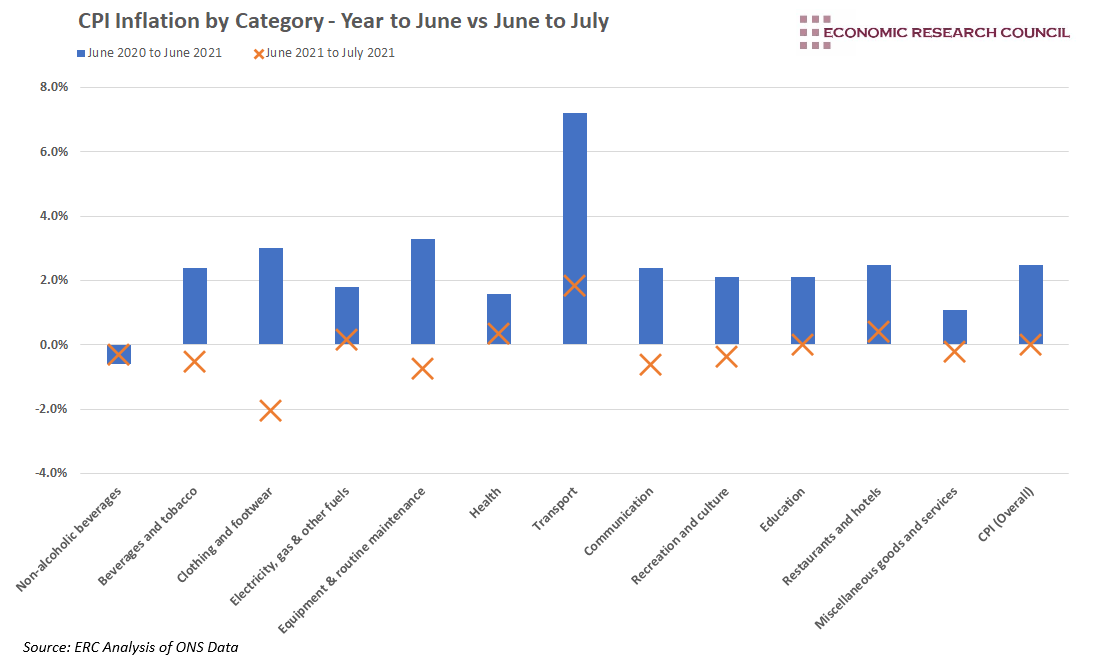
The chart displays the rate of CPI inflation for the UK, split by the components that contribute to the index. Blue bars represent year on year inflation between June 2020 and June 2021, whilst the orange crosses express the rate of inflation between June and July 2021.
Why is the chart interesting?
The rate of inflation has been of considerable concern to some, and simultaneously immaterial to others over the last few months. The rise in CPI to recent highs of 2.5% in June left many observers warning of persistent inflationary pressure. Nevertheless, the Governor of the Bank of England, Andrew Bailey, cautioned against overreacting to a ‘temporary’ jump in inflation. CPI figures from July seem to have justified his advice, with the headline year on year inflation rate falling to the government’s target of 2%. Despite this, the data above strongly suggests that it is too early to claim victory.
As displayed in the chart, the reduction in the rate of inflation was led by falling clothing and footwear prices. After an increase of 3% in the year to June, July saw a reduction in average prices of over 2%, following the usual trend over the summer sales period. Despite this, the prevalence of discounting had been lower in July compared to previous years, as clothing and footwear retailers sought to make up for reduced activity. Due to this, the reduction of clothing and footwear prices was lower than usually seen in July. The temporary effect of sales on prices, in addition to a lower incidence of discounting strongly suggests that clothing and footwear prices will rise in the coming months, further contributing to inflationary pressure.
At the other end of the spectrum, transport experienced the most significant increases in prices in the year to June with an increase of 7.2%. It also led the way in July, increasing by 1.85%. The increases in prices within the transport category were largely attributable to factors of demand and supply. An increase in global demand for oil as lockdowns began to be eased pushed up petrol prices by 3.4p per litre in July according to the RAC. At the same time, demand increased for second-hand cars as people sought alternatives to public transport, whilst a global shortage of semiconductors affected the supply of new cars and drove consumers to the used car market.
Transportation costs are set to rise further in England and Wales as rail fares are linked to the July RPI figure + 1%. RPI inflation stood at 3.8% in July, meaning rail fares could increase by the largest amount since 2012. The overall effect of increases in transportation will be widespread, as the average household spent nearly 15% of their total expenditure on transport in 2019. A shift towards hybrid working should ease that blow, however those that must work at a specific location, usually those on lower wages, will experience a considerable squeeze should this trend continue.
Assessing the data more broadly presents additional insights. Of all the categories in which prices increased between June and July 2021, each increase is larger than the average monthly increase over the 12 prior months. At the same time, categories where prices have fallen, such as recreation and culture, and clothing and footwear as discussed above, are liable to short term fluctuations which may cease to have an effect in the coming months. This all occurred in the context of a 0% rate of inflation between June and July, indicating that instead of inflation cooling off, the headline fall from 2.5% to 2% simply portrayed base effects, stripping out the increase in the rate of inflation that occurred between June and July 2020.
As such, July’s figures do not seem indicative of the future direction of inflation in the UK. Yeal Selfin, chief economist at KPMG suggested these figures “mask the strength of inflationary pressures”, whilst the Bank of England expect inflation to rise to 4% by the end of the year. Nevertheless, a schism still exists between those who expect inflation to be transitory and those who believe it will persist. The Bank of England’s decision to continue its £895bn programme of quantitative easing seems to be keeping its foot on the accelerator pedal for now.
By David Dike


