Summary
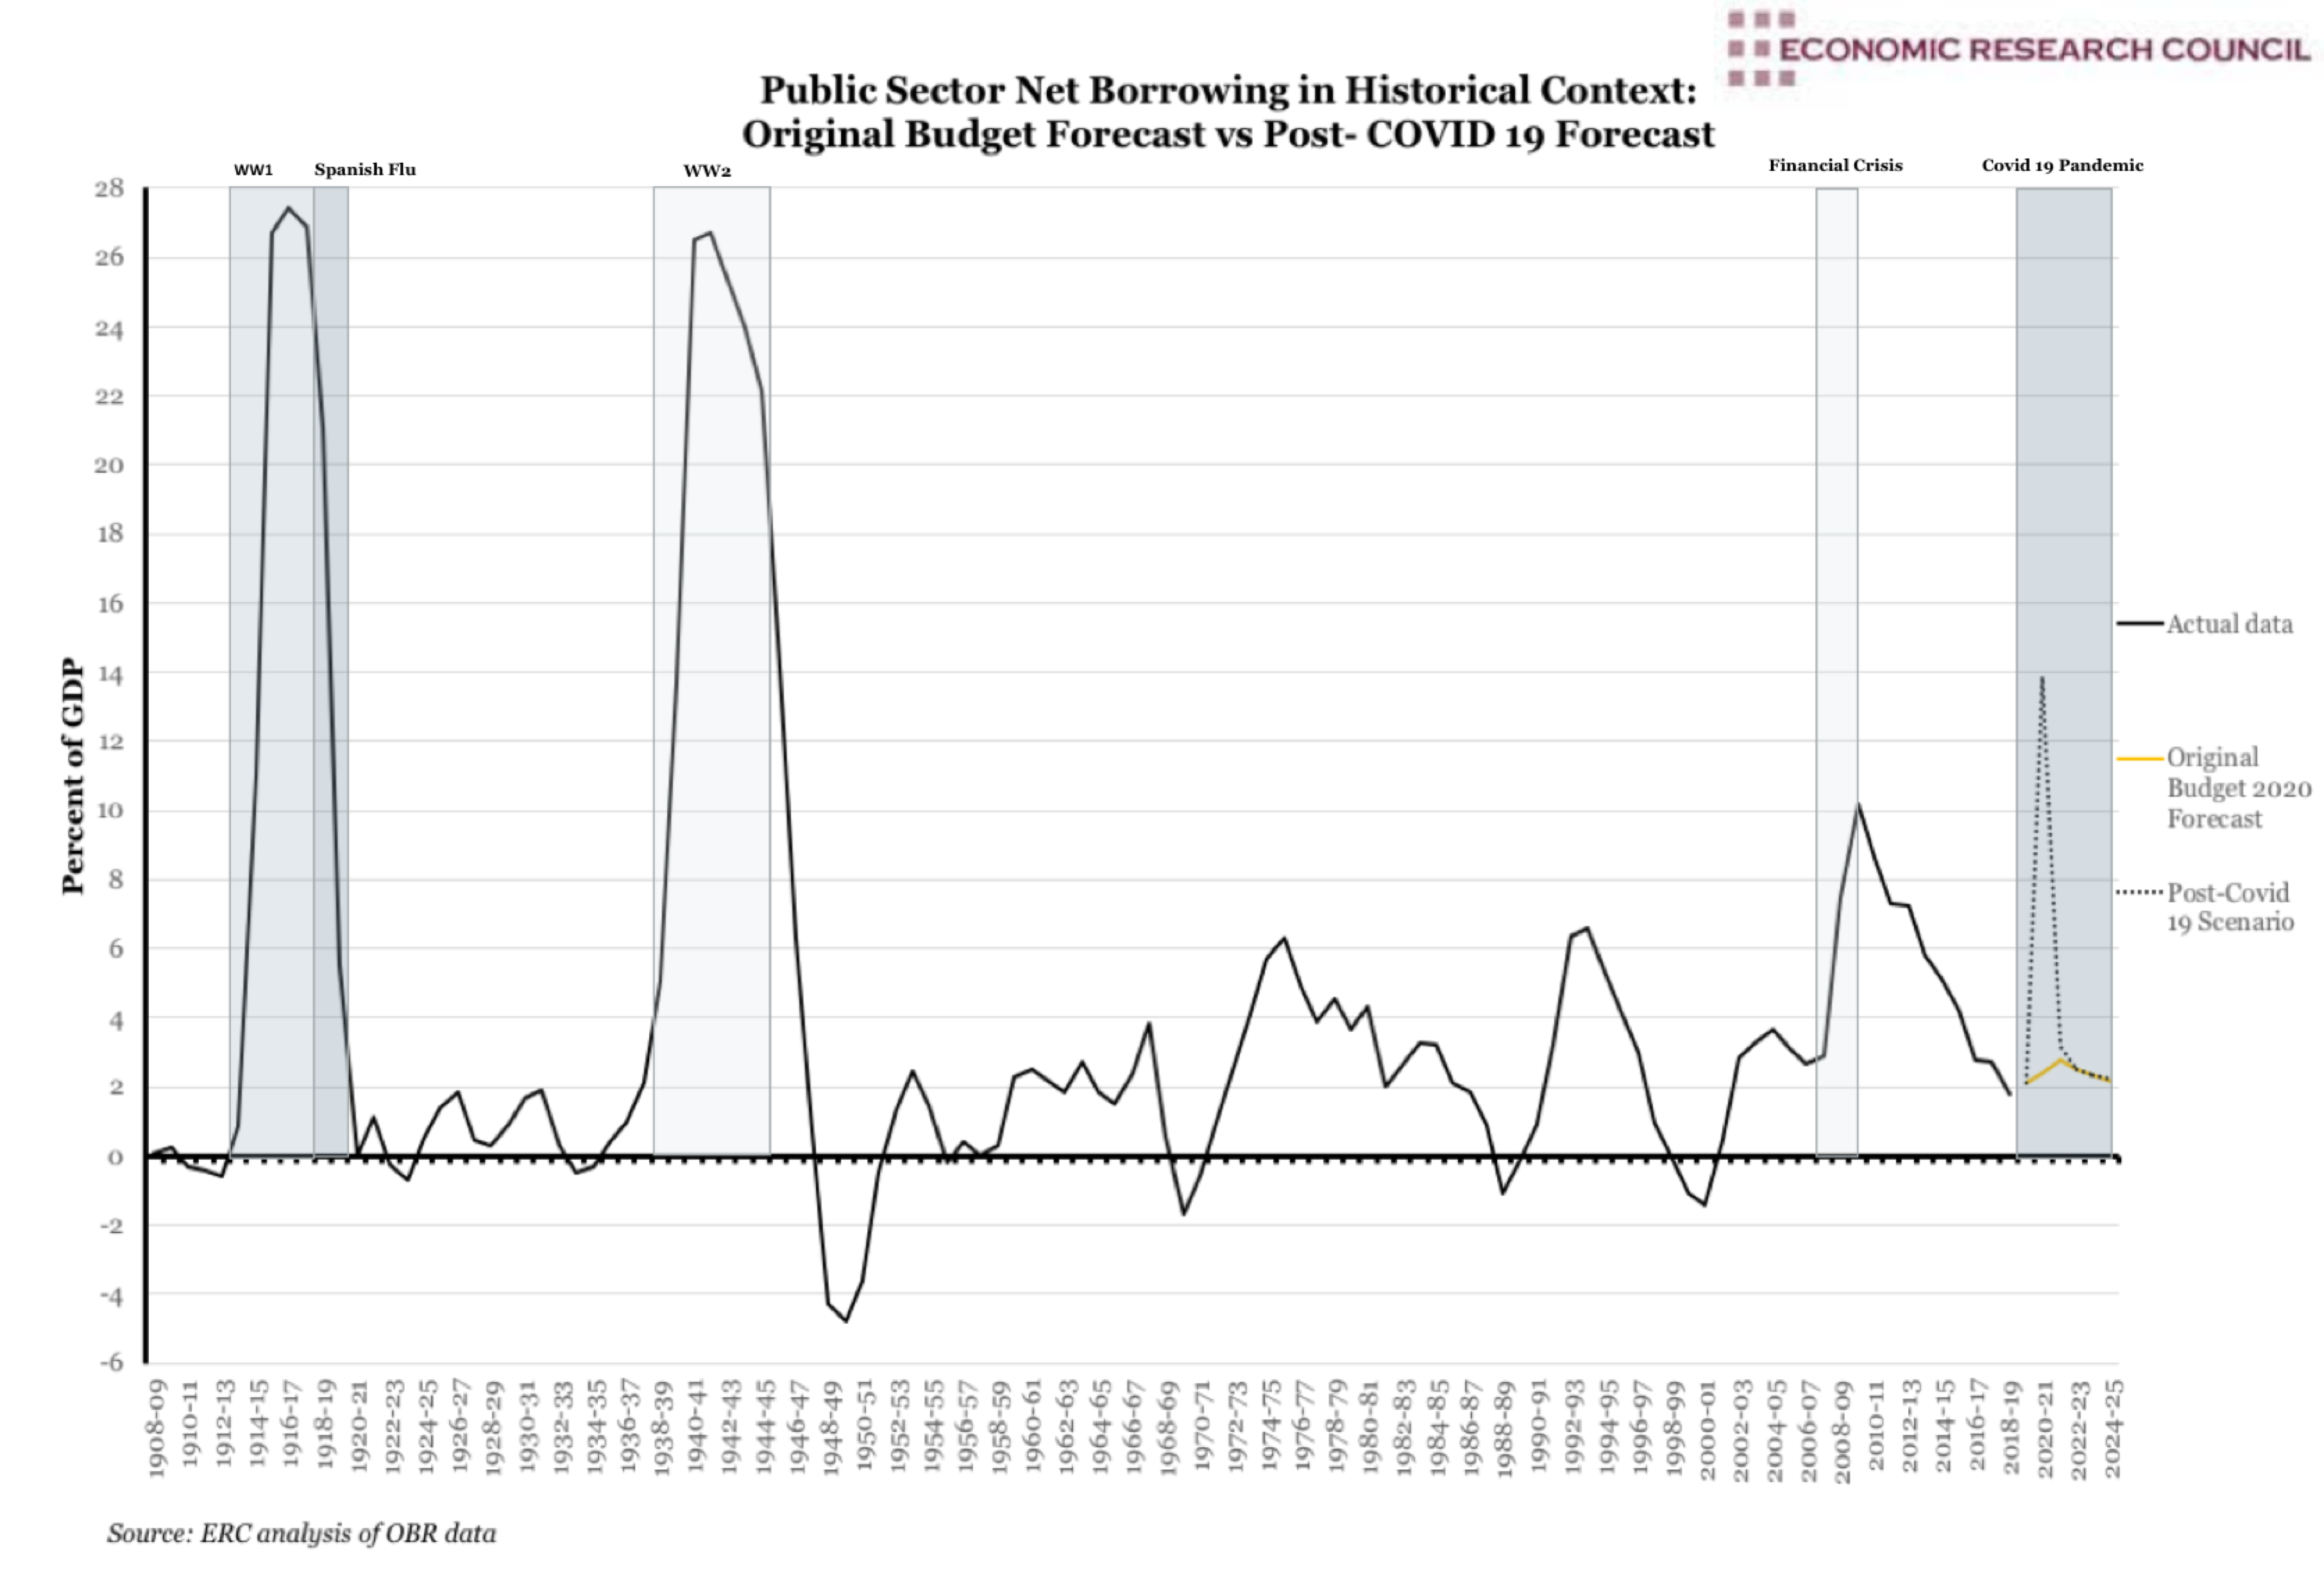
At the end of the Napoleonic Wars, British government debt stood at 200% of GDP – some £1 billion, gradually reducing until the start of World War I, during which national debt soared from £650 million in 1914 to £7.4 billion by 1919. The same occurred during World War II, after which net borrowing was reduced to an average of 5% GDP, fluctuating with the nation’s economic performance.
In the 1970s, the Sterling Crisis saw the UK government seek financial assistance from the IMF, demonstrated on the chart by the spike in borrowing. In the 1980s, with Thatcher disinclined to spend her way out of recession, borrowing remained relatively constant. The recession in the early 1990s saw a rise, followed by the premiership of Blair who increased public spending until the global financial crisis, whereupon borrowing rose to a peak of just over 10% of GDP. We see clearly the effect of the massive contraction in GDP during the 2008 financial crisis, after which borrowing steadily decreased. It was only in 2015 when the Treasury under Osbourne redeemed a £1.9 billion bond remaining from the First World War. Given the lasting impact borrowing can have, the question now is what effect will the current pandemic have, and how long is it likely to last?
What does the chart show?
The chart displays historical public sector net borrowing expressed as percentage of GDP (left hand axis) between the years 1908 and 2018/19. Following 2019 is a projection of likely public sector net borrowing levels per the original 2020 budget forecast in orange. There is also a revised projection, taking into account what we know so far about the effect of COVID 19, in dotted black. The data originates from the Office for Budget Responsibility, who are at pains to emphasise the underlying uncertainty of these ‘broad brush estimates’ and that this forecast is based on the ‘illustrative assumption that people’s movements (and thus economic activity) would be heavily restricted for three months’ and return to normal levels in the three months thereafter.
Why is the chart interesting?
Although subject to significant uncertainty, the OBR’s initial assessment echoes many others’ in that they attribute the huge economic shock more to the effects of the lockdown than large-scale loss of life. Economically speaking, the variation between Spanish Flu, SARs and Ebola stems not from the character of the illnesses, but rather the speed, duration and severity of containment measures, and public sentiment. A 2008 simulation by the World Bank assessing a possible flu pandemic found that mortality would account for only 12% of resultant economic contraction, whereas worker absenteeism through sickness would constitute 28%. Highest of all (60%) was the effect of voluntary or mandatory changes in public behaviour to contain the disease. The Resolution Foundation has asserted that, given relatively wide, swift and strict quarantine and social distancing measures in place for COVID 19, the economic effect will more likely resemble the impact of Spanish Flu than that of the SARs outbreak.
As we can see on the chart, public sector net borrowing is estimated to rise by £218 billion or 14% of GDP. Once the pandemic is over and the rescue policies dismantled, borrowing will likely fall to the original OBR forecast. However, by 2024/25, they estimate that net debt would likely remain at £260 billion or 10% GDP higher than pre-pandemic forecasts. The lockdown measures are severely hampering consumer demand as well as the capacity of both public and private sector to supply.
The overall effect of the pandemic will be a steep rise in borrowing that is likely to be temporary, with the effect on the deficit lasting far longer. The longer the lockdown lasts, the deeper what the OBR terms the economic ‘scarring’ of the country will be, via businesses failing, investments being cancelled and lasting unemployment proving a barrier to re-entring the workforce. Lower incomes and spending combined with weaker asset prices will all serve to erode tax receipts, while unemployment will raise government spending. Should the economic scarring be deep, the budget shortfall will not recover as quickly during the uptick as the economy gets back on its feet, leaving a larger structural deficit in addition to higher debt.
The government rescue policies will not counter the contraction in GDP, but do mean the reduction in total hours worked is a result less of lower employment than of fewer average hours per worker. Private sector output and expenditure appear to decrease less than private sector incomes, preserving that outcome potential once the crisis is over. Despite the unprecedented and, as yet, incalculable, cost of government measures, the OBR have stated that ‘we can be confident that the cost of inaction would ultimately have been much higher.’.

