Summary
One of the prevailing narratives in economics over the past few decades has been the stifling of wage growth. The NAIRU provides an interesting lens through which to gauge labour market slack. The recent decreases in this natural rate provides insight into the stagnation of wages, despite low unemployment and continued economic expansion in the post-recession era. Indeed wage growth has not reached, and perhaps will not reach, its pre-recession level as conventional economic theory might predict. Many factors are causing wage growth to undercut projections, including underemployment, firm level competition, labour mobility, and decreased growth in productivity, among other lingering effects of the financial crash.
What does the chart show?
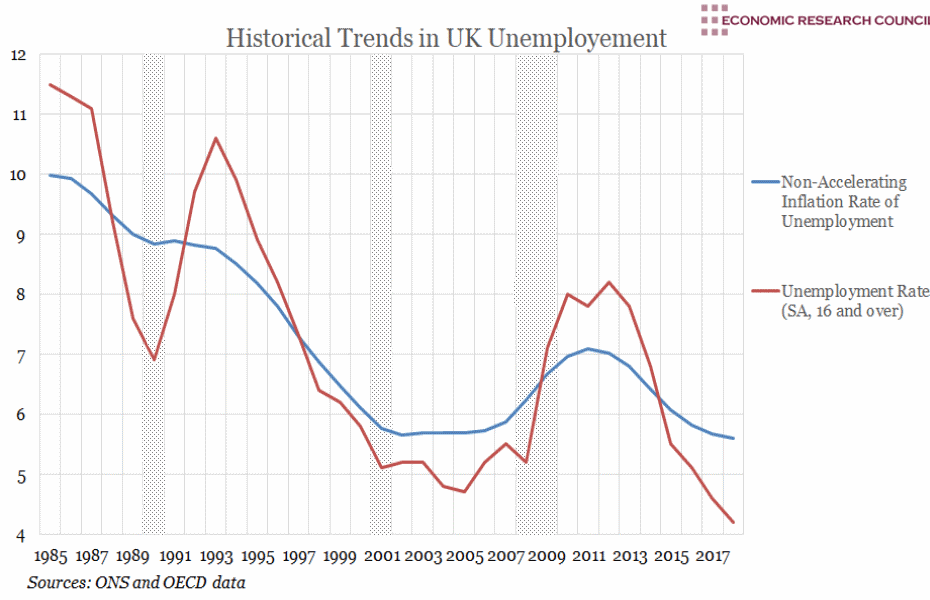
The red line shows the UK Unemployment Rate (Seasonally Adjusted, 16 and over) from 1985-2018. The blue line plots the Non-Accelerating Inflation Rate of Unemployment (NAIRU), which is a measure of the equilibrium or natural rate of unemployment. The equilibrium rate of unemployment is the unemployment rate beneath which inflation begins to rise, or in other terms, when the economy’s output capacity is reached, causing prices to rise as output is maximised. The NAIRU is a reflection of this natural rate as it quantifies the rate of unemployment at which there is no pressure on prices. If the actual unemployment rate falls below the NAIRU, theoretically this would exert upward pressure on wages offered in order to meet labour demand, which the received wisdom suggests would accelerate inflation . The shaded areas in the graph represent periods of recession in the global economy.
Why is the chart interesting?
In February 2017, Mark Carney stated that the official UK NAIRU was adjusted down during the past couple of years due to ‘consistently overestimate[d] wage growth’. Despite optimism from officials that wage growth would return to pre-recession levels of around 4%, these predictions have largely failed to materialise with growth struggling to exceed 2% in many cases. As shown by the chart, the real unemployment rate is currently below the NAIRU. Theoretically, the larger the gap between unemployment and the NAIRU, the more upward pressure on wages (often referred to as a “tight” labour market). However, despite the gap, wage growth has remained stagnant. This necessitates a revaluation of the NAIRU and a reevaluation of expectations of the post-recession labour market, which appears to be subject to more varied forces than previously thought.
In contrast, according to the data analyzed by Bell and Blanchflower, the 2008-2017 Phillips Curve has been flattening, indicating that at any level of unemployment, wage growth will not cause inflation to increase by as much as it “normally” would have, signifying a general lack of wage increases which would put pressure on the price level.
The defiance of expectations in the post-recession labour market is puzzling considering the normalisation and expansion of other economic indicators including GDP growth and the unemployment rate. David Bell and David Blanchflower, in their 2018 analysis of Wage Growth and the NAIRU, point to underemployment as a main determinant of wage growth. A key measure of underemployment is the spread between’under hours’ and ‘over hours’. ‘Under hours’ are measured as the additional number of hours sought by workers. ‘Over hours’ are measured as decreases in hours requested by workers who feel that they are working too much. When aggregate over hours exceed under hours, overall workers are demanding less work and requiring a higher compensationfor any reduction in leisure hours. A higher wage increases the opportunity cost of leisure, thus lowering its relative value and making workers more content with the amount of hours they are working. Thus, real wages will increase and workers will now be satisfied with the hours they are working, where previously they sought fewer. In 2008, the aggregate amount of under hours in the UK economy increased dramatically overtaking the amount of over hours. Today, despite the economic recovery, under hours continue to exceed over hours. To extrapolate from these measures of underemployment, when over hours exceed under hours, unemployment is above underemployment , exertingupward pressure on wages. Conversely, if under hours exceed over hours, underemployment is above unemployment. In early 2018, when the Bell/Blanchflower study was conducted, unemployment stood at 4.6% and underemployment at 4.9%. Throughout the post-recessionary expansion, the gap between these two measures has been steadily decreasing, but as long as underemployment exceeds unemployment, wages are unlikely to grow at their pre-recession levels.
Underemployment is not the only factor affecting labour market tightness. Many have pointed to increased competition and labour mobility as depressing wage growth and productivity. Labour mobility has increased as a result of public policy and refers to both international and domestic mobility. Firms have exploited the increased competition among workers for a supply of jobs which has not increased as fast as the corresponding supply of labour. This has meant that workers are willing to work for a lower wage in order to keep their pre-existing jobs or to break into a new job opportunity. Conceptually, the increase in labour mobility has increased the supply of labour. Some of this labour is cheap, which has served to push wages down.
According Nobel Laureate economist Ned Phelps, increased international competition on the firm side has continued to increase attraction of of cost-reduction, a further indication that wage increases are unlikely. Additionally, recession debt crises contributed to widespread freezes in public sector wages, many of which have yet to be lifted. Concerning productivity, low rates of investment alongside increased labour mobility have contributed to lower growth, especially in the UK. Labour mobility arises here once again as lower wage hires are, on average, less productive than their more experienced, higher wage counterparts. Trends in productivity have also been self-reinforcing; as productivity increases have been accompanied by higher wages, a disincentive for worker to increase productivity. Accordingly, Haltiwanger et al determined that recession-era corporate ladder collapses have meant that workers’ expectations of career and salary advancements have been subdued, further disincentivising productivity increases.
According to economist John Sloman, decreases in union power through policies such as right to work laws and declines in post-recession unemployment welfare benefits have also incentivized many to work for less. However, since wages have not been putting pressure on the price level, monetary tightening is no longer seen as urgent as it once was in order to prevent inflation from exceeding target levels. As long as the low wage growth trend continues, It is likely that interest rates will, , remain at a relatively low level, in order to incentivise further investment and contribute to the ongoing economic expansion.
Although the orthodoxy of the labour market theory has been assessed, other changes to the employment market abound. These include changes in work culture, including the rise of precariarity, automation and the depersonalistaion or standardisation of wages, job applications etc.
Week 49, 2018

