Summary
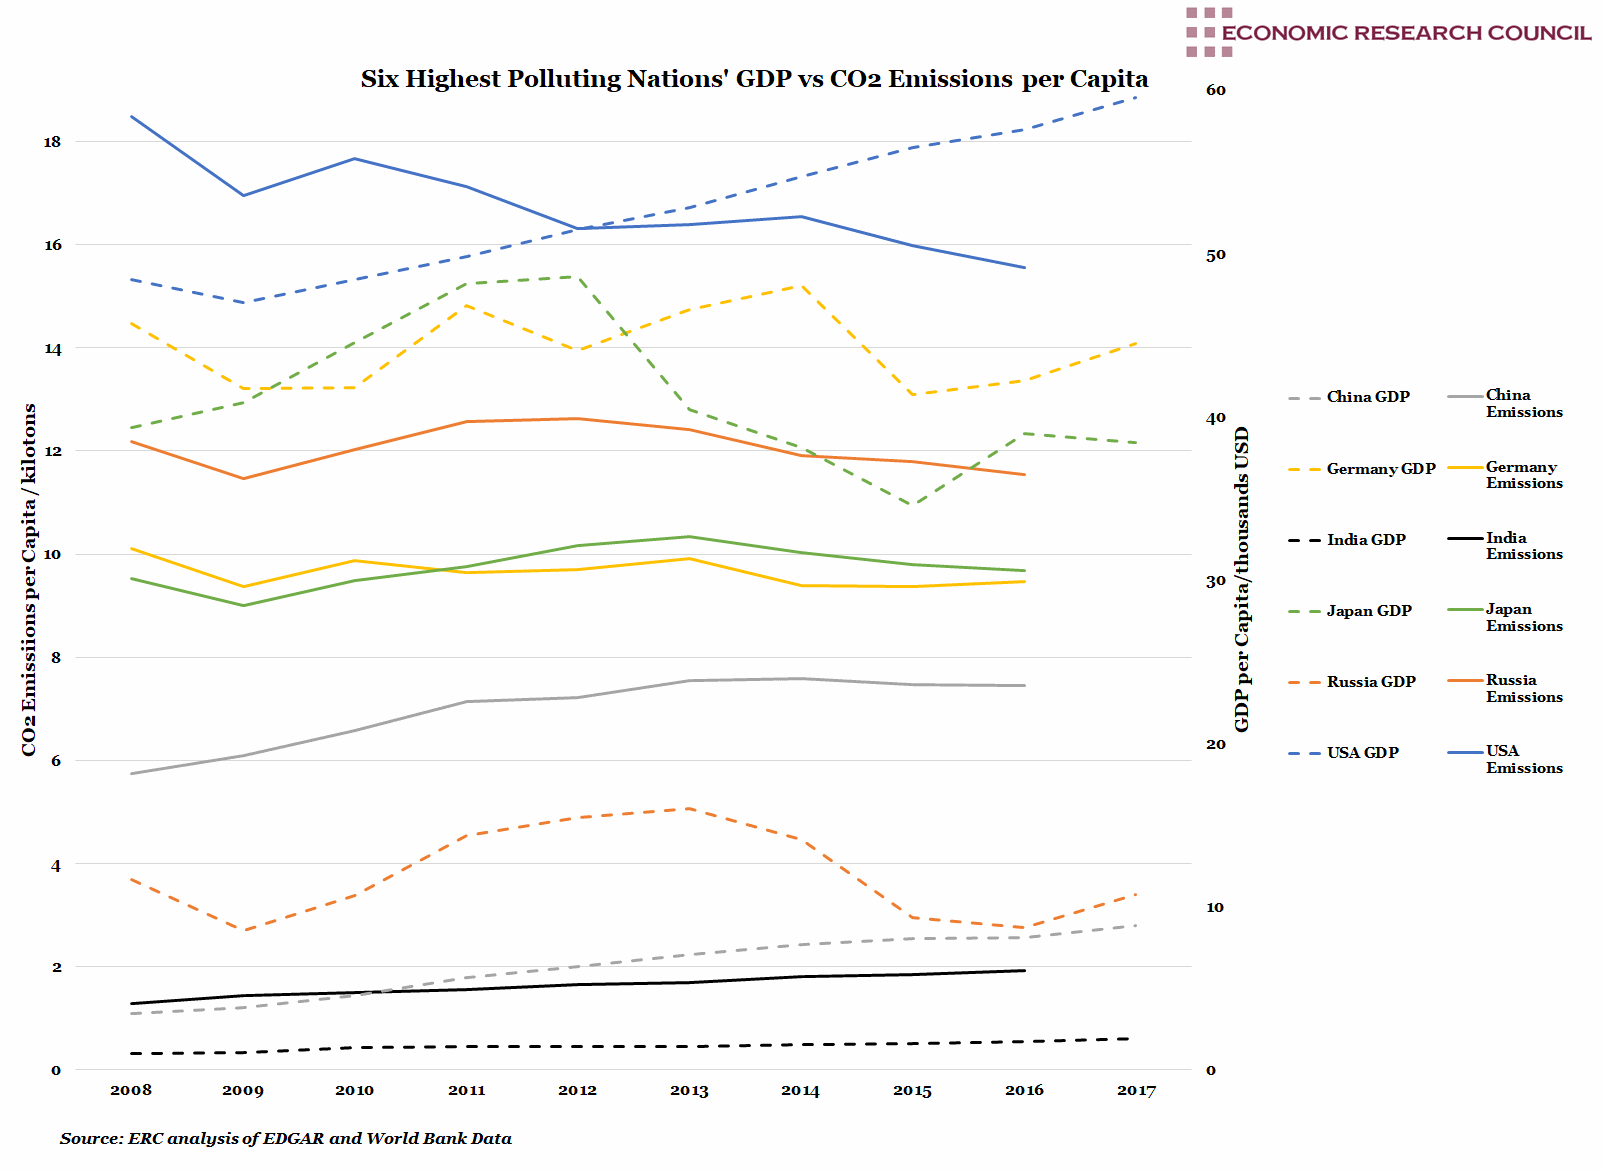
The chart shows the correlation between CO2 emissions and GDP on a per capita basis for the six highest polluting countries globally. The United States has sustained both the highest GDP per capita and CO2 emissions per capita over the period shown. While the US’ GDP per capita has been steadily increasing, their CO2 emissions have been decreasing generally, despite a spike in 2010 and a three-year plateau beginning 2012. Japan and Germany’s per capita emissions (9.7 and 9.5 kilotons respectively) are interesting when contextualised with their GDP growth. Between 2013 and 2015 Japan’s GDP growth correlated with a fall in their CO2 emissions. Russia, India and China all have CO2 emissions per capita that correlate positively to their GDP per capita. Since their peak coal consumption in 2013, China has undergone what appears to be a marginal CO2 emissions per capita decline, but when population size is accounted for, this drop is very significant.
What does the chart show?
The solid lines show the selected nations’ CO2 emissions per capita, measured on the left-hand axis in kilo tons of CO2. The dashed lines display the countries’ GDP per capita, measured on the right-hand axis in thousands of US dollars. The data is presented at annual intervals and spans 2008 to 2017. The most recent data available for CO2 emissions is 2016. The CO2 emission data originates from the Emissions Database for Global Atmospheric Research (EDGAR) and the GDP data originates from the World Bank.
Why is the chart interesting?
The recent IPCC report highlighted a 1.5 °C global temperature increase since pre-industrial times. Further to this, it suggested necessary measures for each nation to curtail global temperature increase to under 2 °C over the coming century. Last year, global GDP grew by 3.8%, alongside a rise in global energy demand of 2.1%. The majority of this demand was met with fossil fuels, which contributed to global CO2 emissions rising by 1.1%. This follows a plateau over the three preceding years. In the 2015 Paris Agreement, it was concluded that an average annual decarbonisation rate of 3% was needed to curtail climate change, however, none of the G20 countries have met this target. The biggest factor in emission changes has been due to a global rise of coal consumption by 1%, to which China alone contributed a growth of 3.5 million tons.
Despite China experiencing GDP growth of 6.9% and a CO2 emissions rise of 1.4% last year, the nation had the highest global decarbonisation rate of 5.2% which roughly halved their carbon intensity over the past decade. Although coal consumption in China increased by 1%, levels still remain 3.5% lower than their peak in 2013. Consumption is forecast to drop in the long term, as the Chinese government has centred pollution control in their political agenda.
India contributes 7.1% of total global CO2 emissions, overtaking Russia in 2009. However, it is interesting to see that their per capita emissions are less than a quarter of China’s and an eighth of the United States’. In 2016, Russia’s total CO2 emissions decreased by just over 2%, to 1.66 gigatons. This was their fourth consecutive year since 2013, where their average decrease was approximately 2%. However, Russia’s per capita emissions stood at 11.5 kilo tons in 2016, around 36% and 38% higher than Germany and Japan respectively. The United States’ 2016 emissions reduction was largely due to an 8.5% reduction in coal usage, which offset a 1% increase in gas and oil consumption.
Recent research has identified a negative correlation between climate change and economic growth. Indeed it is estimated that the negative ‘cost’ to the global economy per ton of CO2 produced is close to $200. The cost to the United States alone is about $50 per ton. This is particularly pertinent, considering that the received wisdom is that only poorer countries are immediately vulnerable to climate change impacts. The US is exceeded only by India in this regard, where the estimated cost to the economy is $90 per ton of CO2 produced.
The introduction and entrenchment of new technologies such as electric vehicles are likely to significantly reduce emissions. It has been posited that new technologies such this could provide one third of the required reduction in emissions needed to limit warming to 2 °C. Among renewable energy, solar energy has been the fastest growing source, with an overall global growth of 35% in the past year. Key players in the solar industry were also among the highest polluters shown: US, China and India with an increase of solar supply of 41%, 76% and 87% respectively over the past year. This was motivated by falling production costs and increased government investment in renewable sources. This was especially so in China, a world leader in hydro and installed wind turbine capacity and where almost half of global solar panel installation occurred over the past year. Latin American regions such as Mexico, Argentina and Brazil have also seen growth in renewables with the impact evident as they are now among the world’s top 10 performers in decarbonisation efforts.
We intend to revisit this chart once EDGAR data becomes available for 2017 and 2018 to assess the impact of the oil price drop.
Week 43, 2018

