Summary
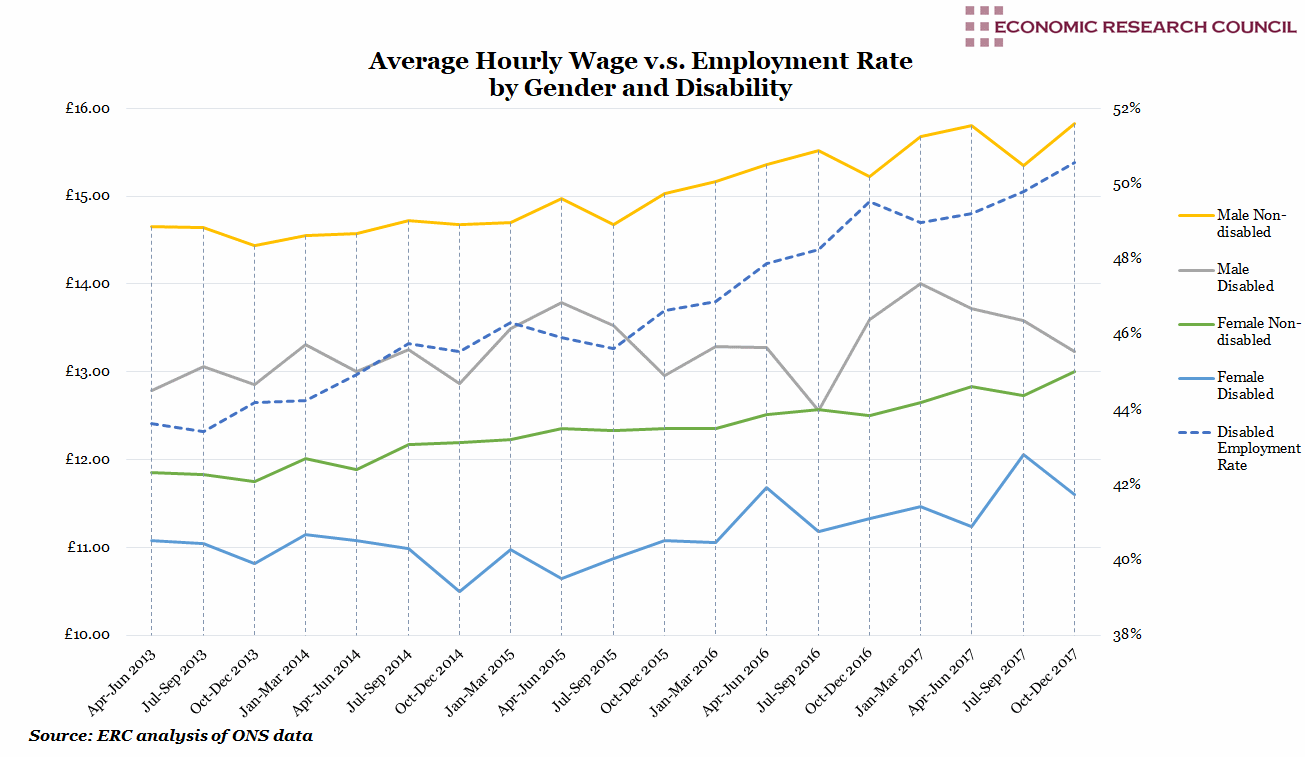
Over the four-year period, non-disabled men’s average hourly wages grew by £1.16 (an increase of 7.9%), nearly three times greater than their disabled counterparts (£0.44). Non-disabled women saw wage growth of 9.7%. At the end of 2017, non-disabled women reached an unprecedented hourly average of £13.00, though still £2.82 less than non-disabled men’s average wage. Disabled women’s wages peaked at £12.06 from July to September 2017 but remained consistently lower than all other groups. While non-disabled men’s and women’s wages have been incrementally rising since 2013, those of their disabled counterparts have fluctuated far more and risen at an almost negligible rate. Disabled men’s and women’s wages rose by 3.4% and 4.7% respectively. The disabled employment rate rose by 7% in the period covered by the chart, as 855 thousand additional disabled people entered employment. Throughout the period shown on the chart, men with disabilities have consistently earned more than non-disabled women. Only in July to September 2016 did non-disabled women earn an hourly wage one penny greater than disabled men.
What does the chart show?
The chart shows the average hourly wage for working adults (aged 16-64) in GBP from April 2013 to December 2017. The data is categorized by gender and disability/non-disability. The Equality Act (2010) defines disabled status as having a physical or mental impairment that has a ‘substantial’ and ‘long-term’ negative effect on an individual’s ability to do normal daily activities. 19% of working age adults are classified as disabled. Employees are more likely to become disabled in the duration of their time in the workforce than to enter the workforce with a pre-existing condition. The dashed blue line represents the employment rate of disabled people within the UK. The data originates from the Office of National Statistics and is not seasonally adjusted.
Why is the chart interesting?
Since the financial crisis, the government has stated its aim to encourage one million more disabled people to join the workforce by 2027, and taken some controversial measures to this effect. It is not possible to attribute the rising disabled employment rate to a solitary factor, but it seems likely that government policies, coupled with workplace accessibility improvements, have contributed to the rise.
Many among the disabled population rely on government support to supplement the additional cost of having a disability, on average £570 per month. After housing costs, 28% of working age disabled people live in poverty, compared to 18% of those without a disability. Multiple recent policy changes in the welfare state have impacted those with disabilities. Personal Independence Payment (PIP) assessments and the changeover to Universal Credit are an increasing determinant of benefit payments awarded to the 13.9 million disabled people in the UK. This has not been without controversy, with a Parliamentary committee recently tasked with reviewing poor treatment under PIP assessments. They deemed the process to be ‘error-strewn and insensitive’, supported by evidence of some 71% of PIP decisions being overturned on appeal. Universal Credit has come under similar fire, as it contains no explicit provision to meet the extra costs associated with disability. Disability charity Scope’s analysis indicates that disabled people stand to lose up to £395 a month in the move from ESA to Universal Credit. Disability Rights UK, another charity, found that up to half a million disabled people and their families will be financially worse off under Universal Credit. Although this may drive more disabled people into work, uncertainty around income and housing may cause disabled job seekers to take more precarious and therefor lower paid employment.
In the period covered by the chart, the national minimum wage has risen by 13 % on average. For under 18s, minimum wage rose 9% and for the majority of workers (over 25 years of age), the rise was 19%. Growth in the minimum wage has significantly outstripped wage growth experienced by the groups in the chart. No data is available on the proportion of disabled workers employed at minimum wage. Average weekly wage growth for all workers, regardless of disability, in this period was 7.3%, still far surpassing that of disabled workers of both sexes. Regardless of gender, non-disabled workers earned over 15% more than disabled workers at the end of 2017.
Inaccessible workplaces, inflexible working policies, and employer reticence to hire are among the many barriers reported by disabled people when looking for work or progressing in employment. Some public figures have perpetuated disability stigma concerning employment. In addressing the UK’s productivity crisis, Chancellor Philip Hammond recently laid some blame for this on the increase of disabled workers in the workforce. Similarly in 2014, then welfare minister, David Freud, insinuated that disabled workers may be ‘worth’ £2 per hour, to the outrage of many disability groups. Over half of disabled people polled by Scope have experienced harassment or bullying in the workplace because of their condition, and 48% of disabled people said they would benefit from modified hours in the workplace.
However, according to analysis from Scope, a five percent rise in the employment rate among the disabled would bring an increase in GDP of £23 billion and gains to the Exchequer of £6 billion by 2030. Currently the non-disabled employment rate is around 81%, while 52% of the disabled population are employed.
Week 41, 2018


