Summary
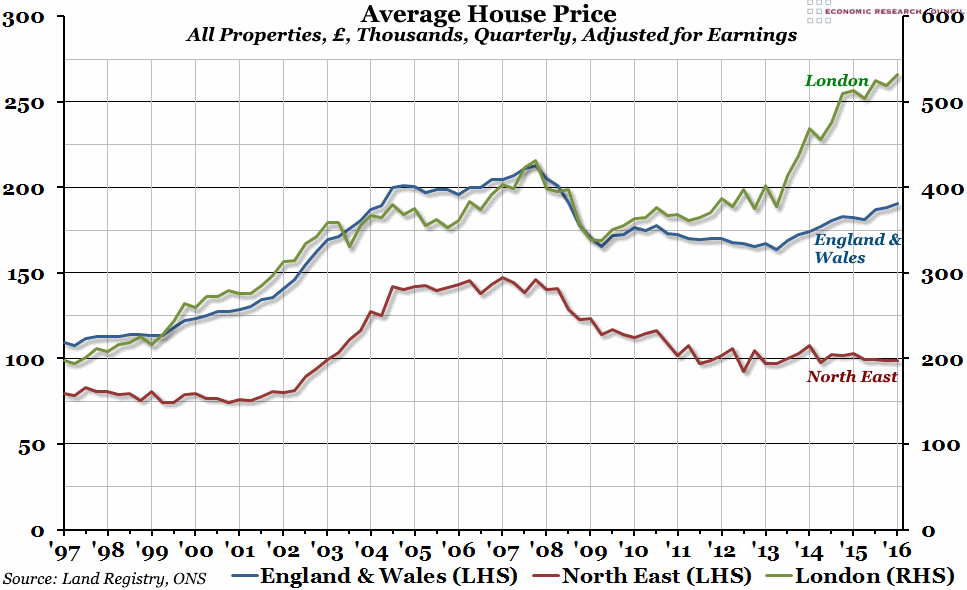
The Land Registry’s data for the first quarter of the year came out recently, showing a 6.5% year-on-year growth rate in nominal prices for England and Wales, while in London, the equivalent rate was 13.8%. These are the fastest annual growth rates since the last quarter of 2014, suggesting that prices are picking up again (in some parts of the country).
What does the chart show?
The chart shows quarterly average house prices, by region, as reported by the Land Registry, in thousands of pounds and adjusted for inflation using regional average earnings. The average prices are calculated using a database consisting of all residential property transactions across England and Wales, standardising price changes based on repeat sales. The blue line represents the average house price in the whole of England and Wales, the red line just in the North East region (both measured against the left hand axis), and the green line in London (measured against the right hand axis).
Why is the chart interesting?
London has been relatively expensive compared to the rest of the country for a very long time, but during the period from at least 1997 until the recession, prices in the capital were consistently double the national average. In the aftermath of the crisis, though, prices in England and Wales remained subdued compared to earnings for a long time, and only started to really pick up again in mid-2013. Growth has been slow but steady, and although nominal prices have recently overtaken the pre-crisis peak, in real terms prices are still 10% below that peak. Meanwhile, prices in the North East of England seemed to have settled at a steady price-to-earnings ratio since 2011, at only a slightly higher level than before the pre-crisis boom period.
In comparison, London prices relative to average earnings recovered quickly, passing the previous peak in 2013. As of the first quarter of 2016, the average London house price was more than £100,000 higher than the 2007 peak in real terms (an almost 25% increase). This seems unsustainable, but as long as London property continues to trade on the international market, it seems that there will be adequate demand to support these prices.
If you’d like to find out more about the performance of the UK property market, come along to the ERC’s Fourth Annual “Boom or Bust” Property Discussion next week, where you’ll get a chance to put your questions to a panel of property experts. For more information, and to book tickets (which range from £10 – £20), please click here.

