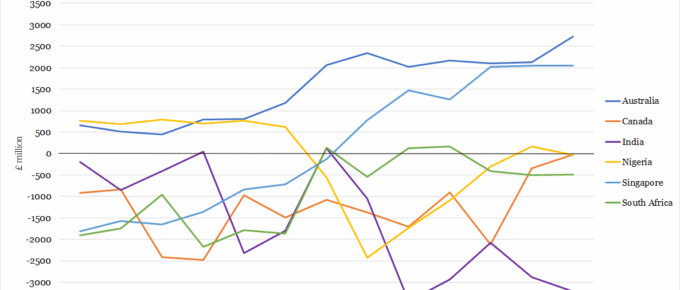
Already existent strong trade ties between neighbouring nations could potentially prove limiting for Britain’s trade expansion …
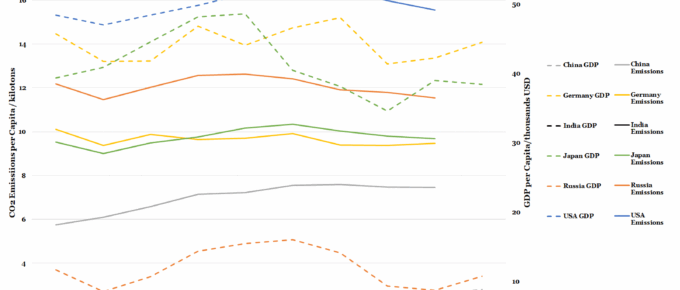
Chart of the Week: Six Highest Polluting Nations’ Emissions vs GDP
Despite China experiencing GDP growth of 6.9% and a CO2 emissions rise of 1.4% last year, the nation had …
Chart of the Week: Ownership of UK Commercial Property by Investor Type
Overseas investors saw the largest increase in UK commercial property ownership in the decade to 2016…
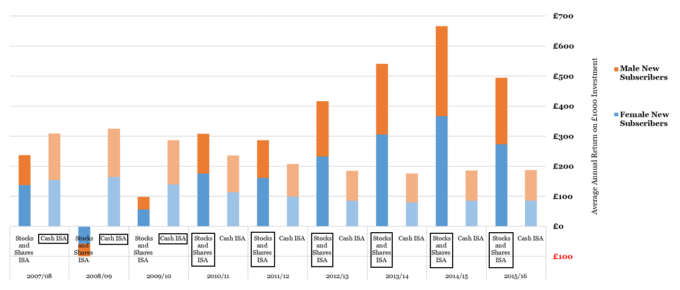
Chart of the Week: Week 27, 2018: Gender Split and Returns of Cash vs Stocks and Shares ISAs
In general, women hold more ISAs than men (an average of 52% across ISA products), however in every year displayed, men are more likely to opt for stocks and shares ISAs when they do invest in ISAs. The number of men subscribing to new ISAs has fallen in recent years, reflecting an increased appetite for other, higher-risk investments…
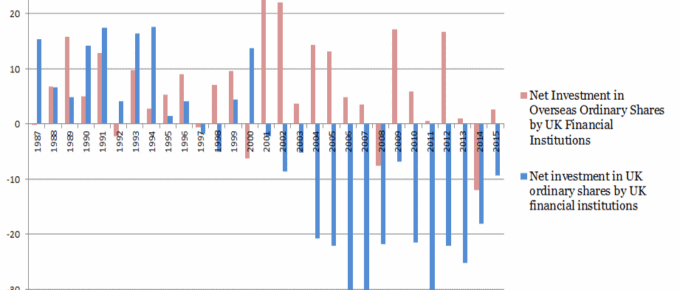
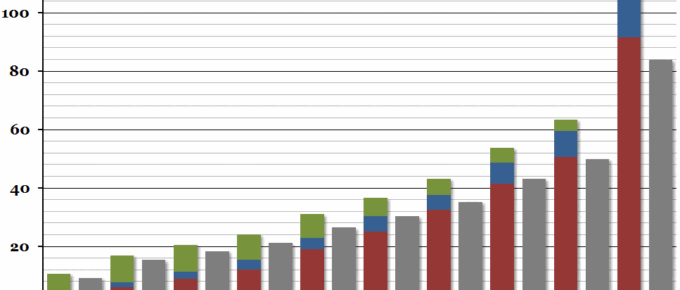
Chart of the Week: Week 40, 2016: Net Investment in UK vs. Overseas Ordinary Shares by UK Financial Institutions
The chart shows that the year 2000 marked a turning point in financial institutions’ strategy, turning their focus to shares in international companies and away from investment in UK business.
Chart of the Week: Week 8, 2016: UK Income Distribution
The Office for National Statistics released a report yesterday on household income for the financial year 2014/15.

