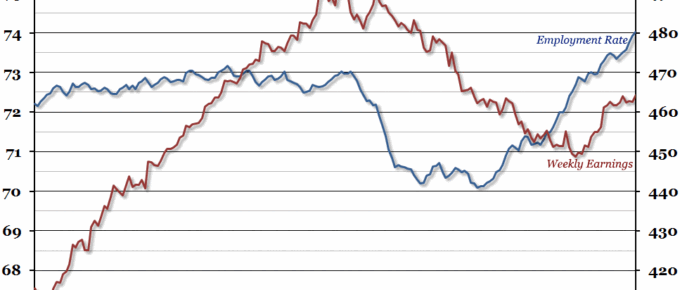
Labour market statistics were released today, and they showed another record high employment rate (74%).
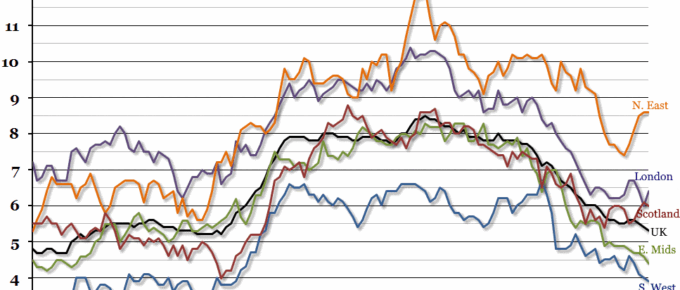
Chart of the Week: Week 45, 2015: Regional Unemployment
After a brief stutter last quarter, the UK’s headline unemployment rate continued to fall in the third quarter of the year, to 5.3% (the lowest it has been since the beginning of 2008, when it stayed at 5.2% for around six months).
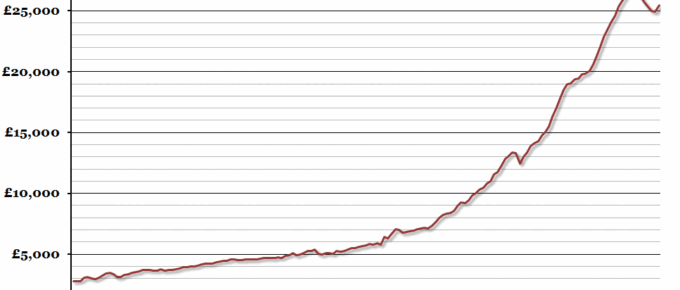
Chart of the Week: Week 41, 2015: Historical Real Average Salary
According to data released this morning, earnings growth remained strong in the three months to August at 2.8% in nominal terms.
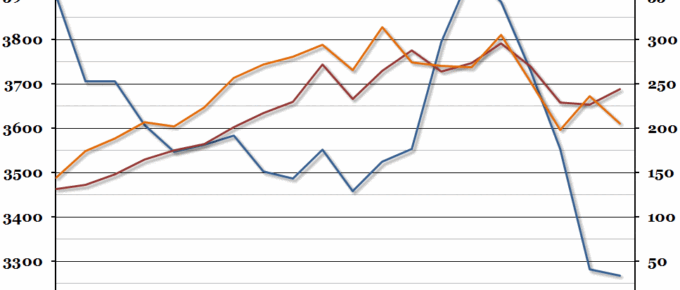
Chart of the Week: Week 40, 2015: UK Workless Households
The annual study from the ONS on workless households in the UK was released yesterday, and it showed a mixed picture with total workless households continuing to fall but the number of households where nobody has ever worked growing.
Chart of the Week: Week 21, 2015: UK Regional Disposable Income
This morning, the ONS released a long-term data series on regional household gross disposable income, which showed that the gap between the richest and poorest regions in the UK had opened up slightly.
Chart of the Week: Week 50, 2014: Inclusive Wealth Index
This week two departments of the UN released a joint report which put forward a new way of measuring a nation’s wealth.

