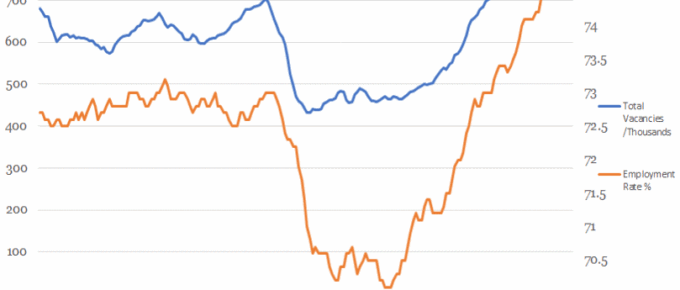
This chart shows that the overall employment rate has been tracked by the number of available jobs until the financial crash.
Chart of the Week: Week 20, 2016: UK Labour Market
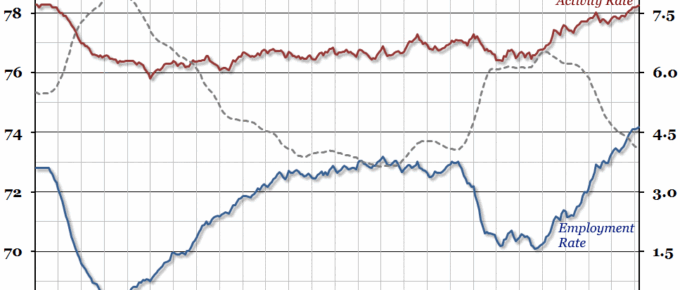
Today’s labour market statistics (for the first quarter of the year) show that the unemployment rate remained at 5.1%, where it has been since November 2015.
Chart of the Week: Week 3, 2016: Employment and Earnings
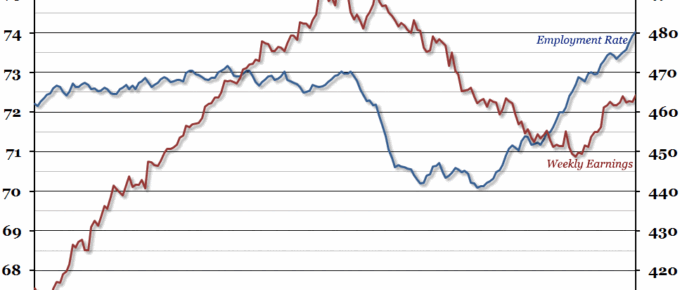
Labour market statistics were released today, and they showed another record high employment rate (74%).
Chart of the Week: Week 3, 2015: Full Employment
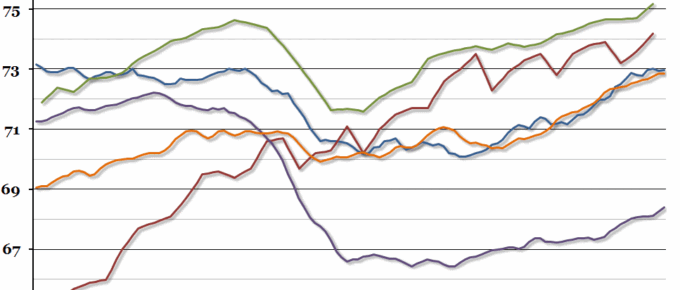
David Cameron set out his aims for “full employment” this week, defining it as having a higher employment rate than other developed economies.


