Summary
London has long led the way for the country’s housing market, displaying extraordinary resilience in its house price growth in recent years. Over the last decade, house prices have grown 2.4 times faster than growth in average private rental prices. The pandemic, as well as the government’s response to it, has put significant pressure on these trends, accelerating the growth in house prices relative to rental prices, and weakening the London housing market relative to the rest of England. The extent to which this continues will depend on how the housing market reacts to the end of the stamp duty holiday, as well as whether the reopening of the economy draws people back into cities.
What does the chart show?
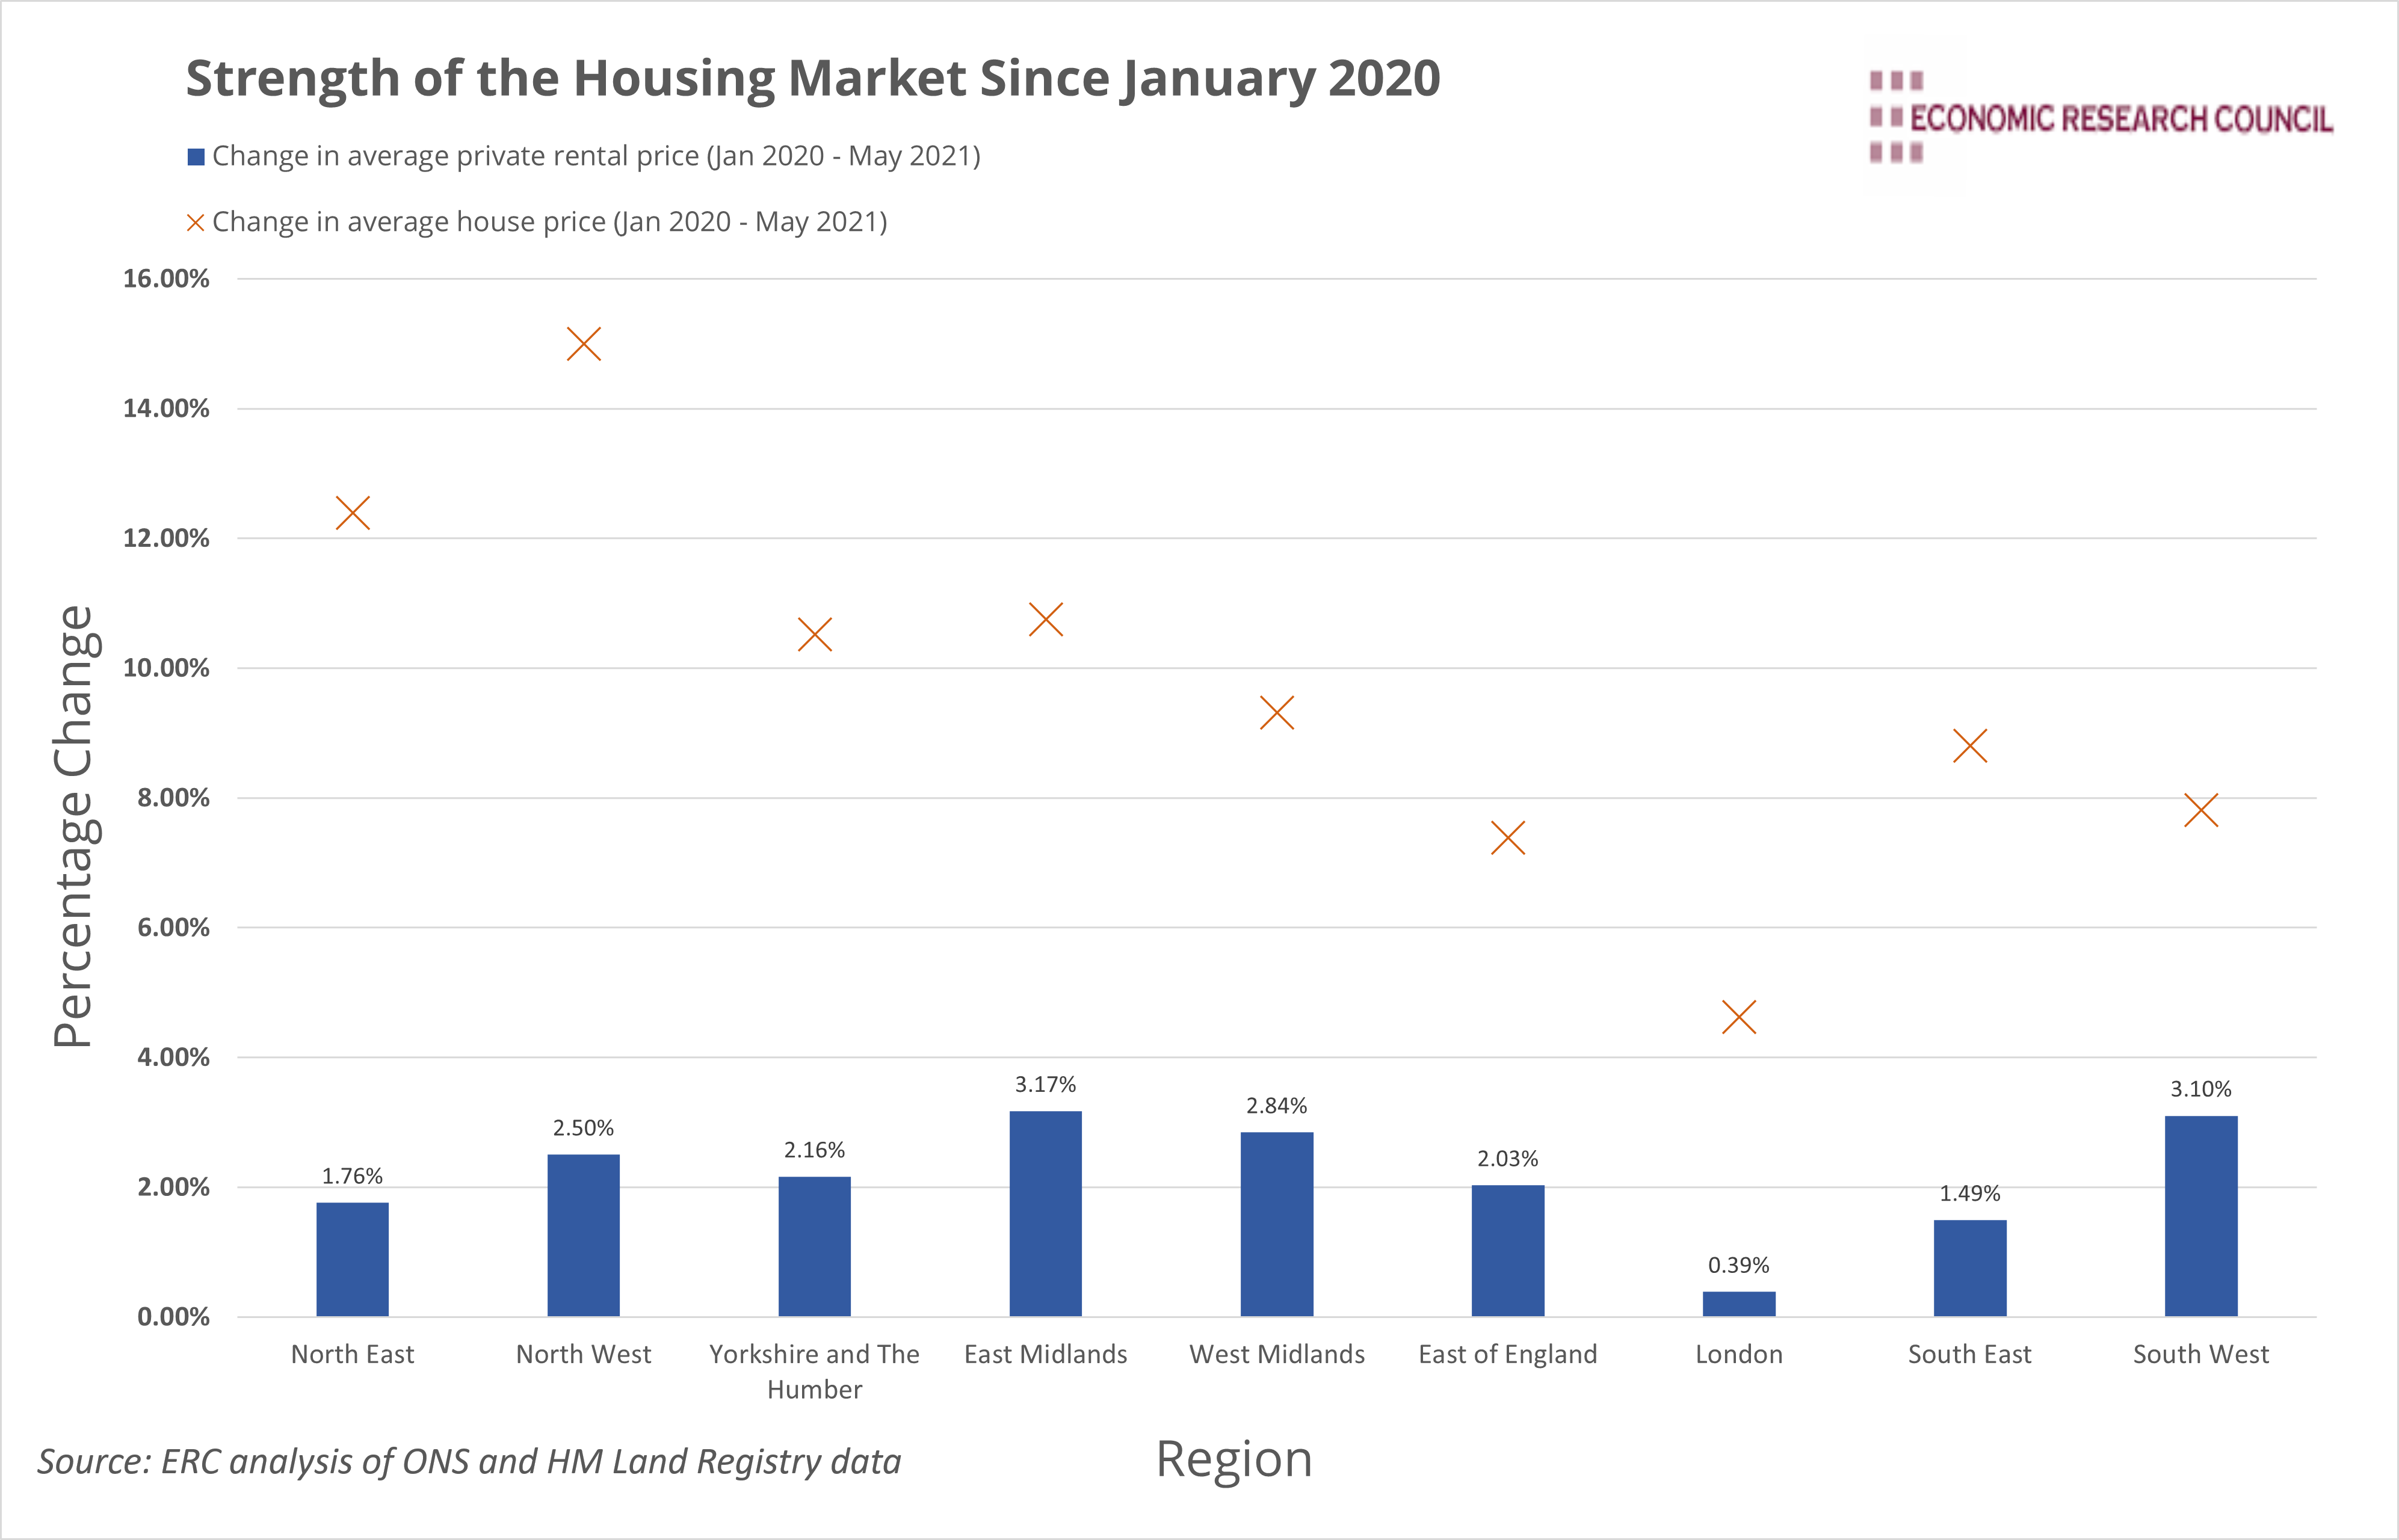
The chart utilises Office for National Statistics and HM Land Registry data to analyse the relative strength of the housing and rental markets in England since the start of the pandemic. It displays the change in average private rental price (represented by the blue bars) as well as the change in average house price (represented by the orange crosses) for all regions of England from January 2020 to June 2021.
Why is the chart interesting?
The uncertainty that came with the pandemic threatened to place the housing market into a state of paralysis, largely through the delaying of prospective buyers’ decisions. Social distancing measured dealt another blow to the industry, disabling viewings between March and May 2020. As a result, house prices in England fell by 4.1% between Q1 and Q2 of 2020.
The increase in house prices displayed in the chart provides evidence to suggest the issues above have been tackled, especially as each region other than London and the East of England experienced higher growth rates than the 2010 to 2020 English average for the same time period. Despite this, the data displays some important discrepancies, both regionally, and between the housing and rental markets.
Every region in England showed a growth in average house prices between January 2020 and May 2021, with an average increase of 9.6% over the period. Similarly, each region of England experienced an increase in rental prices, although the average increase of 2% was far lower than that of house prices. London’s increase of 0.39% masks the decrease of 0.1% that it has experienced since June 2020. The fate of the Midlands and the north of England highlight the geographical divide in the housing market. In the North West, house prices grew at over three times the rate of prices in London, with every region outside of the south and east of England growing at over double the rate of prices in London. The rental market displays a similar picture, despite the smaller magnitude of the increases. Nevertheless, in Q2 of 2021, the average asking rent for homes outside of London passed the £1,000 for the first time in history.
The cooling of London’s property market can be explained by several factors. The much-discussed exodus of Londoners in search of additional space as they transition to working from home has decreased demand for housing, particularly within inner London. However, the misfortunes of the tourism industry have also played a part. A reduction in the number of people visiting the city has decimated demand for short term lets. According to Rightmove, this has resulted in excess supply of housing as short term lets become converted to long term lets, putting further downward pressure on rental prices in the capital.
Aside from the geographical disparity, the chart displays a clear divergence between the housing market and rental market. Between 2010 and 2020, house prices grew at an average rate that was 2.4 times higher than the growth of private rental prices. Since the onset of the pandemic, the average house price growth in each region has accelerate to 5.4 times the average growth rate of private rental prices, creating problems for those aiming to get onto the property ladder.
Whilst the factors dictating London’s relatively weak property market are largely due to a somewhat natural human response to the changing circumstances that Covid-19 has brought, the discrepancy between house price growth and growth in average rental price seems less pure. The stamp duty holiday came into effect in July 2020 with the aim of supporting the housing market in addition to boosting expenditure through the wealth effect that arises due to an increase in house prices. It is clear to see that one outcome of the policy has been inflated house prices across the country, due to buyers accelerating decisions to purchase property, borrowing more than they otherwise might have and sellers increasing asking prices.
The stamp duty holiday has begun to taper out and ends in September this year, which may well result in further upward pressure in house prices before a subsequent fall once the scheme ends. Beyond this, the trajectory of house prices in the regions of the UK is likely to be dependant on confidence as well as the manner in which people’s interaction with their workplace evolves as a result of the pandemic. If normality resumes this could result in a resurgence of the London property market into 2022.
By David Dike

