Summary
The recent energy price cap has gone some way to protect smaller energy companies in recent weeks, due to spiralling wholesale costs. We chart wholesale gas prices, assessing the impact that gas storage has played on prices.
What does the chart show?
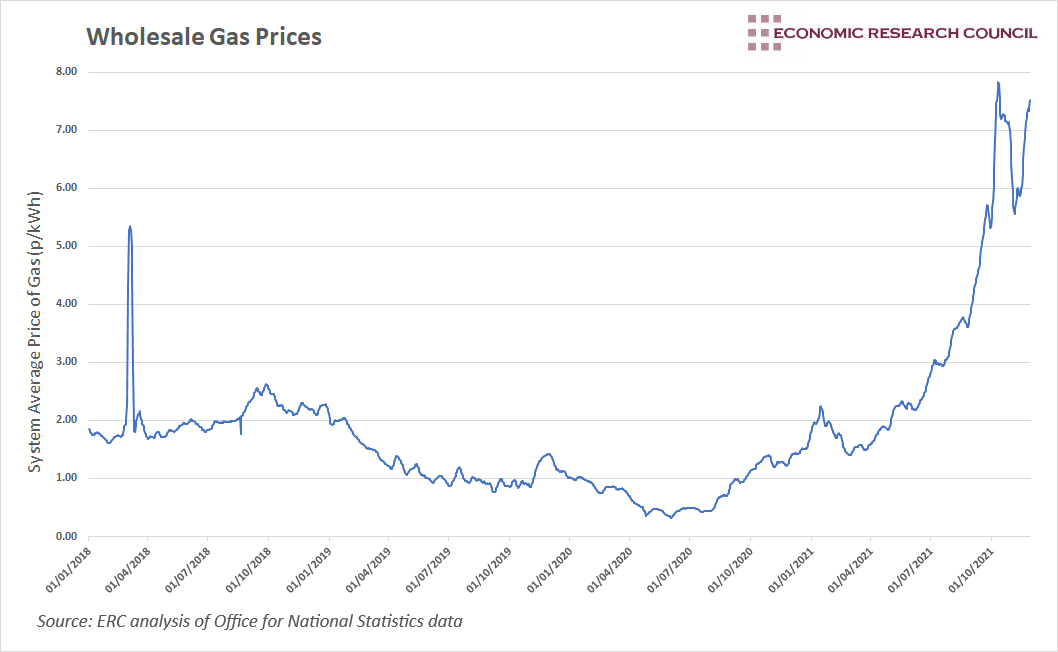
The chart displays the 7-day rolling average of the System Average Price (SAP) of gas in the UK in pence per kilowatt-hour. The SAP is the average price of all gas traded through the balancing market and does not include futures contracts. After a spike in 2018, the SAP remained relatively stable up until the sharp increase that has resulted in the current high price of gas.
Why is the chart interesting?
With a flurry of energy companies failing in recent weeks, Bulb being the most notable of these, attention is firmly placed on the energy sector. The raising of the energy price cap has attracted a lot of attention and may have assisted in keeping some smaller providers in the market. This week’s chart analyses wholesale gas prices, and what the future may hold if prices continue to rise.
April/March 2018 saw a sharp increase in gas prices, rising by more than 200% in just over a month. Around this time, the UK was amid the ‘Beast from the East’ causing a large spike in demand for gas. Further to this, several import outages limited the supply of gas to the UK. As such, early 2018 was characterised by shocks, which had a short-term impact on the price of gas, with normality resuming by the middle of March.
Rather than an immediately self-correcting spike that reverts within a month, wholesale gas prices have been on the rise since March of this year.
A key issue in understanding the UK’s ability to adapt to changing conditions in gas markets is the capacity of storage available to us. The UK currently holds around 1% of Europe’s available gas storage, compared to 16% for Germany. The closure of the Rough storage facility in 2017 left the UK vulnerable to changing conditions in gas markets. However, this is not the main cause of current gas prices, and the issue of storage is not solely a British one.
The whole of Europe came into this winter with the lowest levels of gas stored in 10 years. As of 1st December, European storage sites were only 67.5% full according to Gas Infrastructure Europe. This is compared to an average of 84% full on 1st December over the previous 10 years. This struggle to increase storage levels fundamentally arose last winter, as stock depleted to under 30% of capacity. The last time stock was this low was in 2018, falling to below 20% of capacity. However, unlike 2018, Europe has struggled to build up the stock of gas. Storage facilities were under 80% full during the peak of the restocking phase that ended in October; this is the first time this has occurred in the last ten years.
Gas storage levels are already on the decline, as is to be expected at this time of the year. However, their starting point is slightly more worrying and has the potential to prolong the spike in gas prices. A colder than expected winter will place increasing pressure on gas, depleting stock even further, and increasing gas prices.
The rise in the price cap has already shifted some of the burden onto consumers to ensure the viability of energy companies. Rising wholesale prices will serve to place additional pressure on these firms in the future. Ofgem can review the price cap twice a year, so, depending on the weather, global demand for gas, and our ability to meet our energy requirements from other sources, we could well experience higher energy prices in 2022.
By David Dike


