Summary
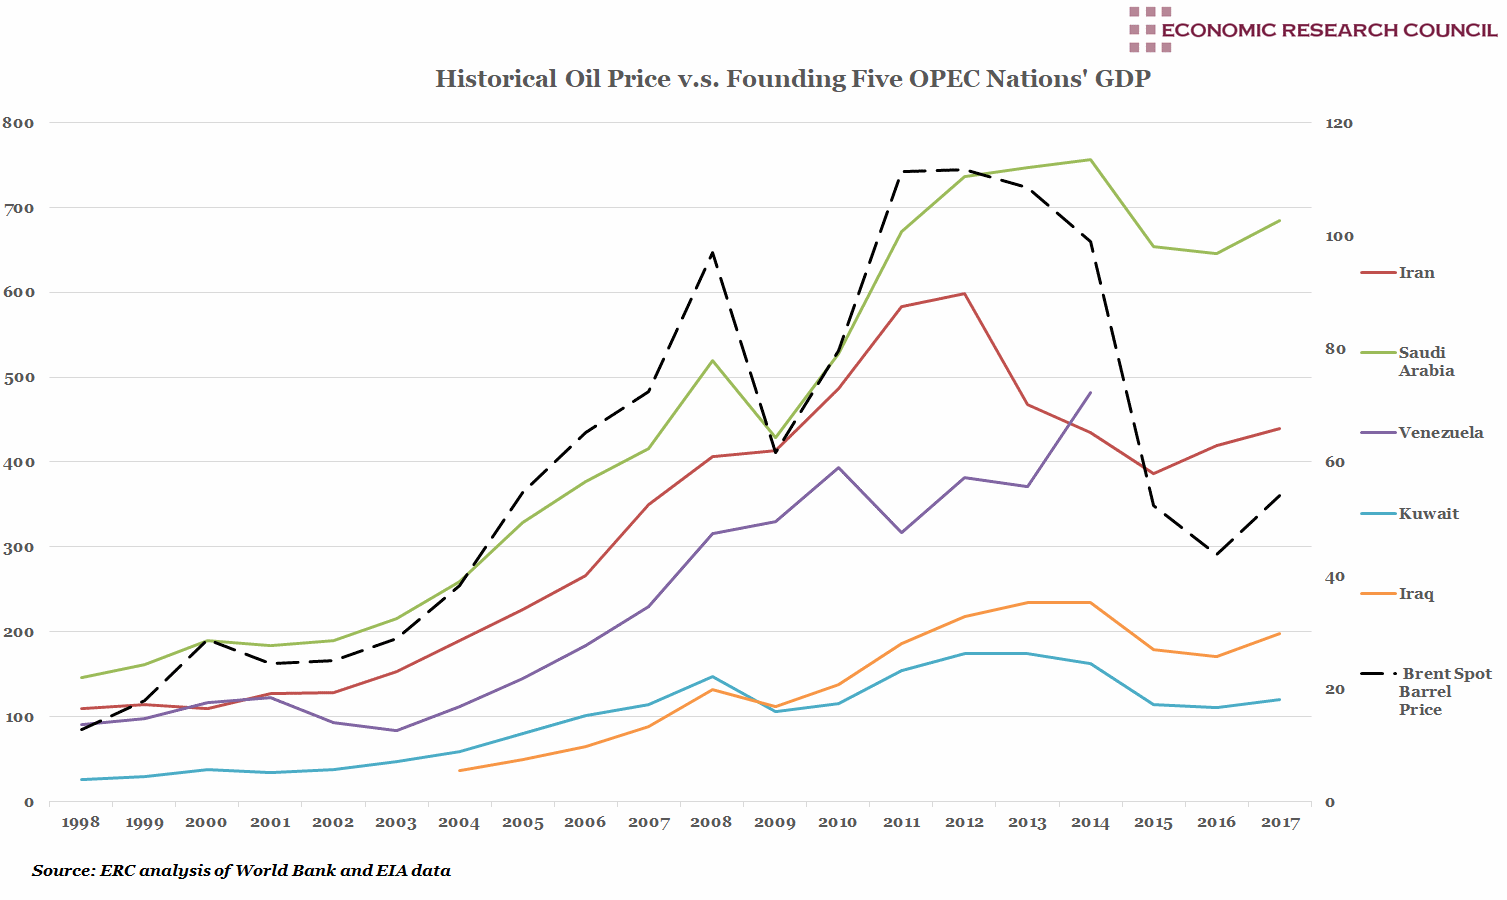
The chart shows the five founding OPEC nations’ relationship to oil showing, in most cases a strong positive correlation between their GDP and global oil prices. The turn of the millennium ushered in a period of relative oil price stability, likely due to implementation of the OPEC oil price band mechanism in 2000. 2004 began a period of increased volatility and a surge in prices, which predictably crashed as a result of the global financial crisis in 2008. Oil price recovered swiftly to pre-crisis levels within 2 years until a second dip in 2014 attributed by many to oversupply. From 2010 towards the end of Hugo Chavez’ life, Venezuela begins to emerge as an anomaly with their GDP no longer correlated to oil price like the other nations shown. Kuwait’s consistently low GDP on the graph is almost deceiving considering the petroleum-based economy of only 4 million residents is the fifteenth wealthiest in the world in terms of GDP per capita. OPEC cites changing trade patterns (with demand shifting from the OECD to Asia), and socio-political unrest within the OPEC nations as key reasons why these nations have experienced such varied growth, although all, bar Venezuela, appear to remain reliant on oil price.
What does the chart show?
The black dashed line shows Brent crude oil barrel price, measured against the right-hand axis in US dollars. The solid lines display the real GDP of the five founding members of OPEC and are measured against the left-hand side in billions of US dollars. The data is presented at annual intervals and spans 1998 to 2017. There are gaps in the chart as GDP data for Iraq is unavailable between 1991 and 2004 and Venezuela recently stopped reporting GDP due to economic crisis. The GDP data originates from the World Bank and the oil price data originates from the U.S. Energy Information Administration.
Why is the chart interesting?
OPEC recently projected their first forecast for 2019, stating that global demand for crude oil from OPEC would be at 32.18 million barrels per day, down 760,000 barrels per day from 2018. This reduces the strain on supply from Saudi Arabia, who has recently been attempting to compensate for underproduction from Venezuela and Libya and mitigate the effects of US sanctions on Iran. Saudi production in June 2018 alone was the main reason for the rise of OPEC oil output at a rate of 173,000 barrels per day to a total of 32.33 million barrels per day. While the Saudi economy is oil-based and largely government controlled, the nation has been attempting to grow the private sector in order to diversify and employ more Saudi citizens. These efforts are reflected on the graph with the strong correlation between oil price and GDP waning since 2014.
As a result of sanctions, Iranian oil exports have already dropped by some 300,000 barrels per day since the start of 2018, and a further drop of 500,000 barrels per day is anticipated. Consequently, OPEC oil price is much higher and more power is shifted towards non-OPEC members, who currently forecast a supply expansion of 2.4 million barrels per day in 2019. This would vastly exceed anticipated global oil demand growth (by nearly 1 million barrels daily). This additional oil is expected primarily to originate from the US, but include Brazil and Canada. Reflective of the regional power struggle, Saudi Arabia appears keen to produce more oil to balance OPEC and non-OPEC markets to counter the effect of sanctions on Iran. Predictably, Iran is unwilling for another OPEC member to take over their share of oil exports, particularly while Saudi Arabia and Iran have on-going proxy wars. Despite the already visible impact of sanctions, Iran’s focus remains on gaining OPEC support against the US, whilst salvaging the nuclear deal with European nations.
Looking at oil production outside the Middle Eastern members, it is clear that Venezuela, despite possessing 25% of the world’s crude oil reserves, have found themselves particularly vulnerable to price fluctuation, due to higher cost of extraction and domestic economic crises. Economic instability, mass protest, nationalisation of oil companies and hyperinflation within the last decade have severely impaired the Venezuelan economy and the global oil market. Historically, almost all of Venezuela’s export earnings have been from crude oil. In Africa, Nigeria has been showing consistent and rapid growth in GDP since the turn of the millennium. They had the third highest GDP after Saudi Arabia and Iran from 2010 to 2013, surpassing Iran between 2013 and 2016. Of the current OPEC members, Gabon (which rejoined in 2016) has consistently had the lowest GDP of all OPEC nations. Indonesia, a former OPEC member, has experienced a remarkable surge in GDP, surpassing Saudi in 2008. Indonesia’s strongest growth was between 2009 and 2016, catalysed by their breaking away from OPEC, lifting the organisation’s limits on their oil production.
Decreasing prices of renewables and subsequent increased market competitiveness, technological advancements and new interest by global powers such as China, Japan, India and Middle Eastern nations all stand to affect the elasticity of oil price.
Week 39, 2018

