Summary
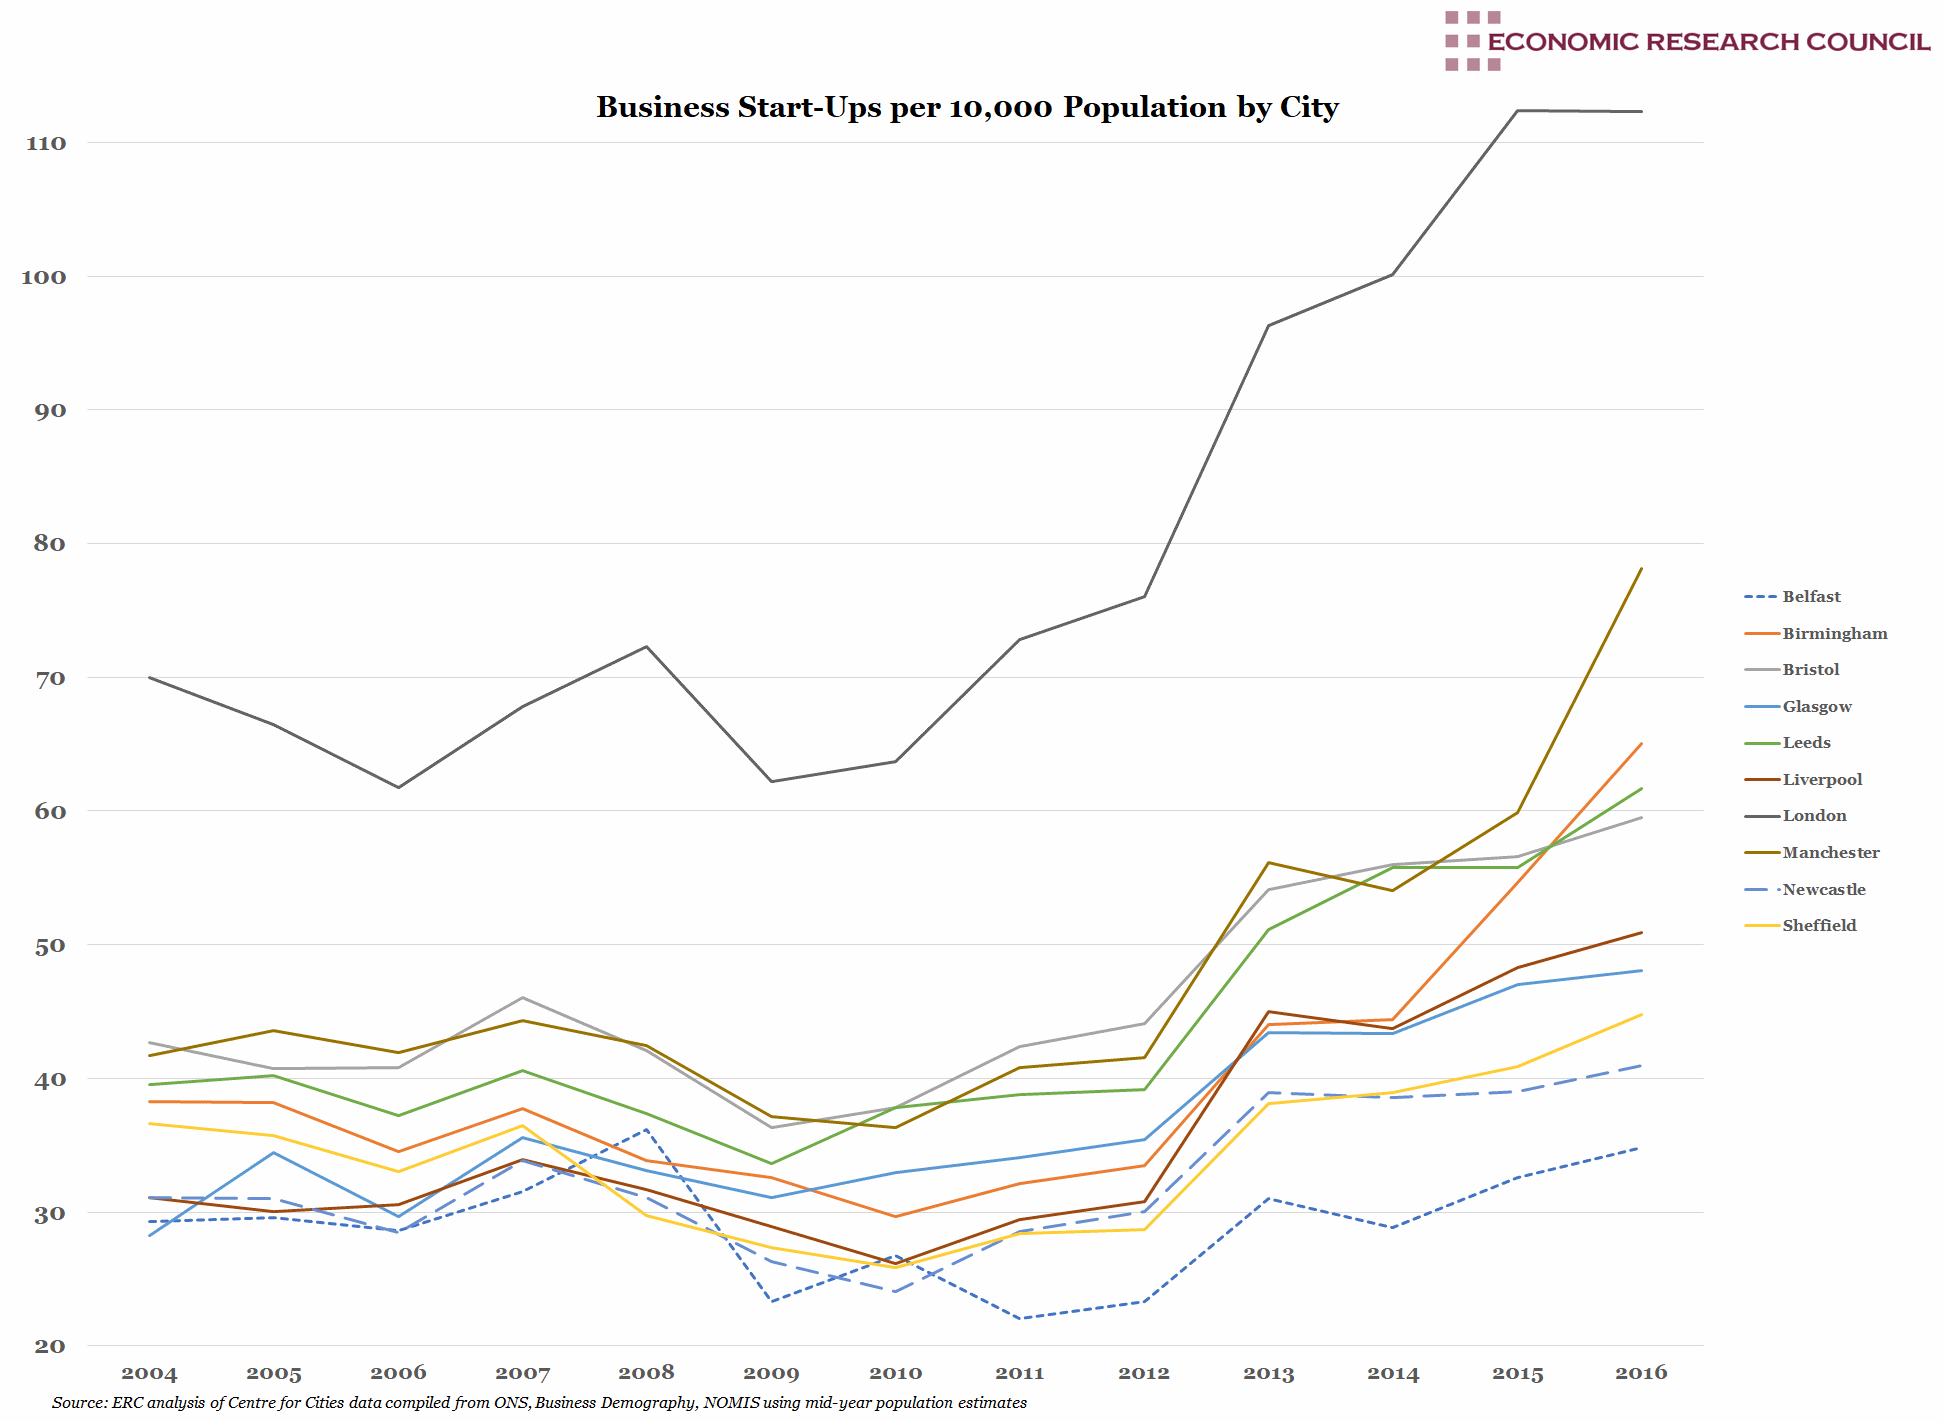
The chart shows that in all of the UK’s largest cities, the number of business start-ups has recovered from and exceeded pre-crisis levels. London was the first to recover from the crash in terms of new businesses, reaching 72.8 start-ups per 10,000 population in 2011. Seven of the remaining nine cities shown recovered to pre-crisis levels in 2013. In Newcastle in the North East, which has the lowest rate of new businesses of all regions in England, new business growth has been fairly flat. No city has had lower growth in new businesses than Belfast, which only saw an increase of 18% in the period shown. The biggest success stories on the chart are Glasgow and Manchester, which both saw an overall increase in the number of start-ups of 70% and 88% respectively.
What does the chart show?
The chart shows the number of new businesses started in each of the top ten UK cities. The number of start-ups is shown per 10,000 population, using mid-year population estimates. The data is from Centre for Cities and runs from 2004 to 2016. Here ‘start-ups’ refers to new business formation, not in any specific sector.
Why is the chart interesting?
Across the ‘northern powerhouse’ cities of Manchester, Liverpool, Leeds, Sheffield and Newcastle, there appears to be no universal story. Manchester’s start-up growth has no-doubt been bolstered by the opening of MediaCityUK in 2011, which now houses the BBC, ITV, the University of Salford and some 40 SMEs and tech start-ups. In Liverpool, a city which has historically relied on commerce and distribution rather than industry, new business growth has been more subdued.
Since 2011, new business formation has outstripped business closures, with the gap widening until the beginning of 2016. The ONS attributes the increase in business closures in 2016 to economic uncertainty following the Brexit referendum result. However, persistently low interest rates reduce financing costs for business and go some way to offsetting uncertainty. The depreciation of sterling, leading to higher raw material and import costs, may be a headwind to the formation of new business.
In 2016, 44.1% of new start-ups formed in 2011 had failed, although there is great variation within this figure. In 2016, London had the lowest five-year survival rate (41.7%), something that could be attributed to the sheer volume and high costs of new businesses formed in the capital. When broken down by industry, there is similarly wide variation. Health and property start-ups have survival rates of just over 54% and 51% respectively, whereas just 34% of food and accommodation services reach the five year mark.
Some credit the flourishing of new businesses since the crash to government policies, such as the launch in 2011 of Start-Up Britain. The initiative introduced and increased tax breaks for entrepreneurs, investors and SME owners. This was followed by a loans scheme in 2012, where some £300 million of loans were issued to over 46 thousand start-ups through the British Business Bank, a state-owned development bank. More recently, Philip Hammond’s attempts to raise taxes for the self-employed were withdrawn following a large backlash from those who felt risk-taking and entrepreneurship was being punished.
With all this new business activity, Britain’s longstanding issue with productivity might seem perplexing, but many of these enterprises are either sole traders or employ very low numbers. Professor Mark Hart, director of the Enterprise Research Centre, was quoted in the FT asserting that ‘the majority of our businesses do not grow…Too many of these businesses do not create jobs or do anything for UK productivity.’. He furthered that most successful entrepreneurs simply need low taxes citing his 2015 study of 2000 successful start-ups which found that the majority of them received no help from government.

