Summary
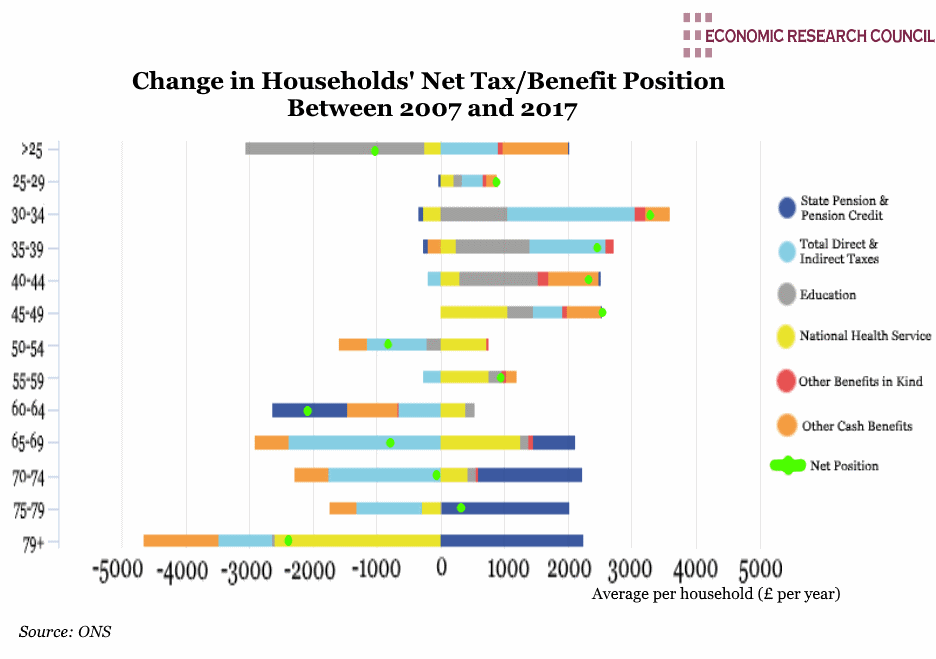
A little under 50% of the shown cohorts are in a worse position in terms of taxes and benefits than in 2007. Households headed by people aged 30 to 49 years have all benefitted by an average of just over £2.6k, a change driven by an increase in state-funded education coupled with a reduction in both direct and indirect taxes. Households headed by 60 to 69-year-olds have had their net position eroded over the decade to 2017. For households headed by those 60 to 64, changes to State Pension provision, specifically the raising of the female age of retirement, was responsible for the worsening of their position. For the next age cohort up, the deterioration in their net position was due to increased indirect taxes alongside rises in their State Pension payment and other incomes, which have increased their Income Tax liabilities. Despite this uptick in taxable income for this age group, the proportion of those aged 65+ employed or seeking employment has fallen slightly since 2016. For those households headed by a person aged 65 or over, the effect of the ‘triple lock’ and the State Pension Credit is clear in the improvement of their net position since 2007.
What does the chart show?
The chart displays the change in households’ financial relationship with the state over the period from financial year ending in 2007 to the financial year ending in 2017. It displays the taxes paid and/or benefits received along with their net position over the decade shown. The data is from the Office of National Statistics and is broken down by the age group of the ‘reference person’ or head of the household. ‘Benefits in kind’ refer to government subsidised and free goods and services, for example the NHS, education and childcare provision. The cost to the government is calculated and a financial value to each household is based on this. Direct and indirect taxes comprise Income Tax and VAT, among other duties.
Why is the chart interesting?
Following the 2010 election, Labour lost power to a Conservative -Liberal Democrat coalition, which introduced sweeping austerity legislation. Described by the FT at the time as the’ most drastic…in living memory’, the budget cuts amounted to £81 billion over four years or around 4% of GDP. This included £7 billion cut from welfare support and the loss of nearly half a million public sector jobs. Throughout the chancellorship of George Osborne, the drive to reduce public spending continued and some of its effects are visible in the chart.
Although the chart sheds some light on the distributional effect of state policy, the chart does not reveal a vast amount about living standards in real terms. Although households headed by those in the millennial age bracket appear to be better off in tax/benefit terms, research shows that the number of adults aged 25-34 living with their parents (and therefor not ‘householders’ in their own right) has risen by 37% in the decade since 2007.
Looking at the tax burden by income bracket, the richest quintile paid on average 23.2% of their gross income in direct taxes in 2017, compared to 12.7% for the poorest fifth. For the richest fifth, 70% of taxes went toward income tax, whereas for the poorest fifth the largest bite (over 50%) taken was for council tax. Before taxes and benefits are accounted for, the richest quintile had a household income of nearly £89k per annum, 12 times that of the poorest quintile. Once the redistributive effect of benefits and taxes are accounted for, the poorest quintile had an income 5 times lower that the richest.
In the vast majority of households (those headed by a person 25 to 64 years old), the household generally pays more in taxes than they receive in benefits. The opposite is the case for households headed by those 65 and over. The most tax paid in 2017 originated from households where the head was 50 to 54 years of age, some £20.3K per annum. Although households headed by 40-44 year olds paid the third highest amount of tax, they were more likely to have children in state school so receive the highest benefits of any cohort under State Pension age, some £16k per year.


