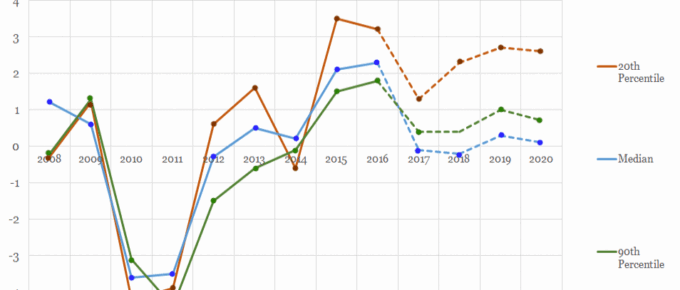
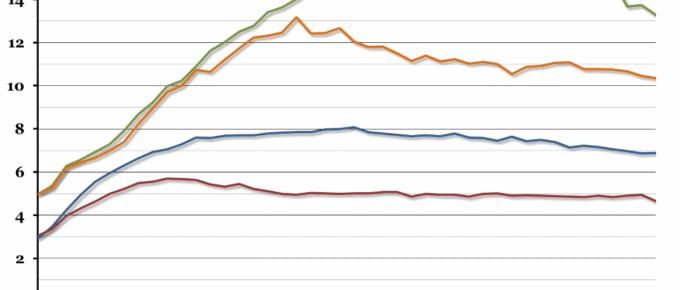
The chart shows that take home wages for the 2nd and 9th decile of earners have been strongly correlated in the years since the financial crisis.
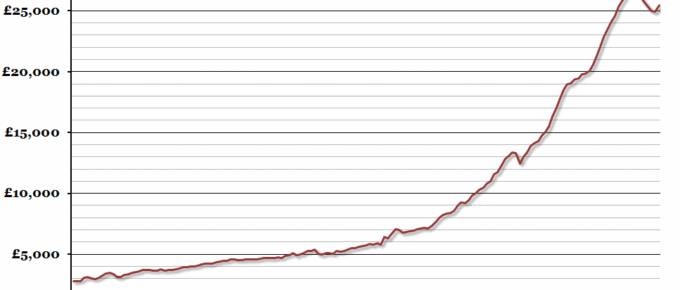
Chart of the Week: Week 41, 2015: Historical Real Average Salary
According to data released this morning, earnings growth remained strong in the three months to August at 2.8% in nominal terms.
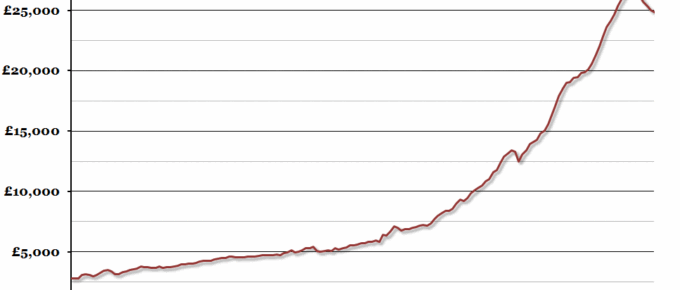
Chart of the Week: Week 42, 2014: Real Average Salary
In a report released over the weekend, the TUC claimed that the current squeeze in real earnings is the most severe since our records began almost 160 years ago.
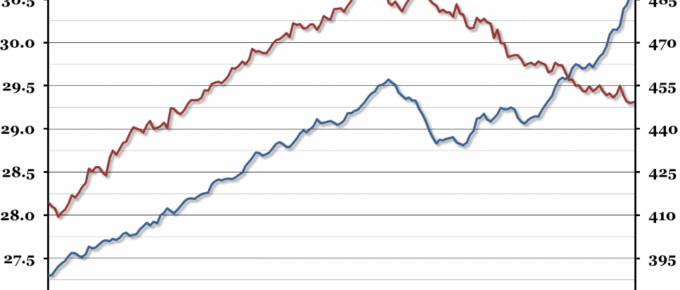
Chart of the Week: Week 29, 2014: Employment and Earnings
While the total level of employment in the UK continues to break records, real average wages are still declining steadily.
Chart of the Week: Week 28, 2014: UK Wage Differences
At the end of last week, the ONS released a report on how wages have changed over time, particularly for three cohorts born in 1954, 1964 and 1974.

