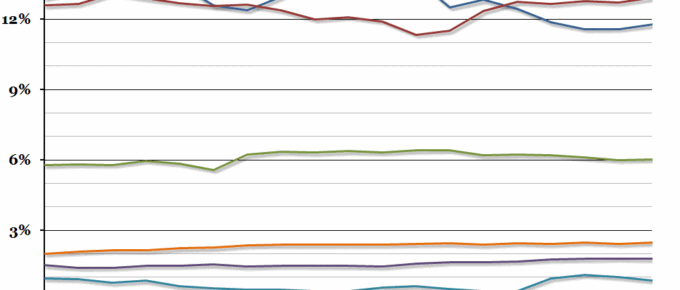
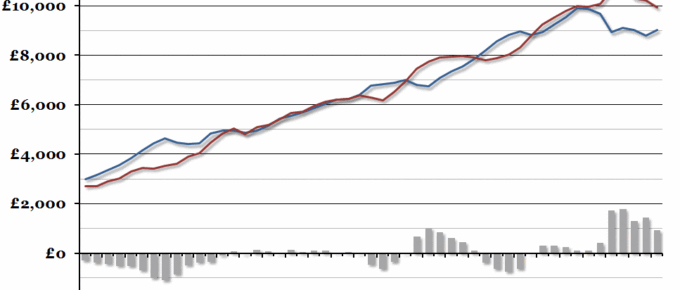
Yesterday, the Office for National Statistics released updated figures for the UK government finances in the financial year 2015/16.
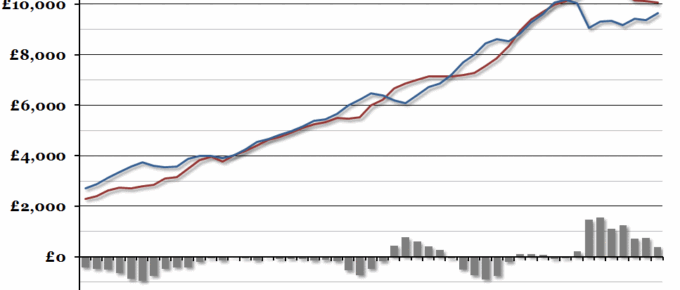
Chart of the Week: Week 11, 2016: UK Central Government Finances
We’ve updated our annual chart on central government finances per person in time for this afternoon’s UK Budget speech.
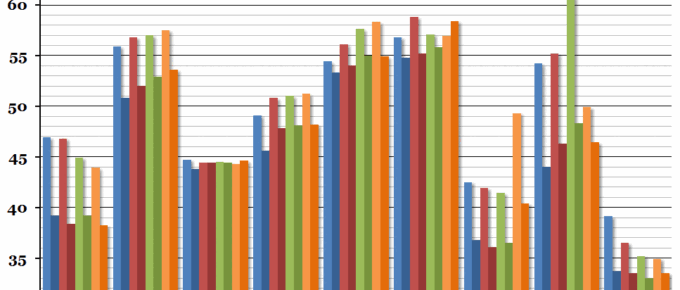
Chart of the Week: Week 42, 2015: EU Government Finances
Eurostat announced their updated statistics for European government finances this morning, and the headline figure showed that across the EU, the average deficit improved from 3.3% to 3%.
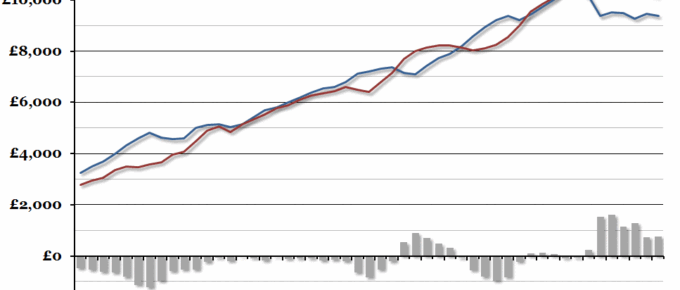
Chart of the Week: Week 11, 2015: UK Central Government Finances
With the annual UK Budget due this afternoon, we’ve updated our yearly chart showing the central government finances per person.
Chart of the Week: Week 12, 2014: UK Government Finances
This afternoon, the Chancellor will present the UK Budget for the coming year.

