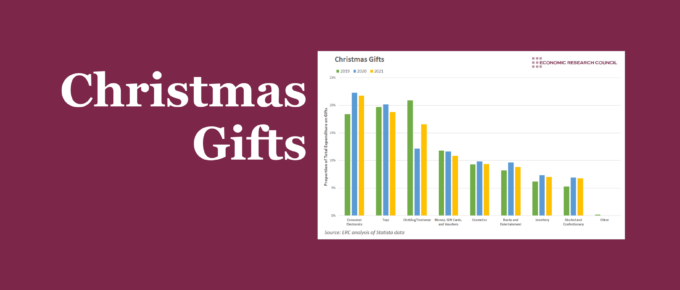
The pandemic has affected countless aspects of our lives, but how has it altered our spending on gifts?
Chart of the Week: Week 14, 2016: UK Household Spending
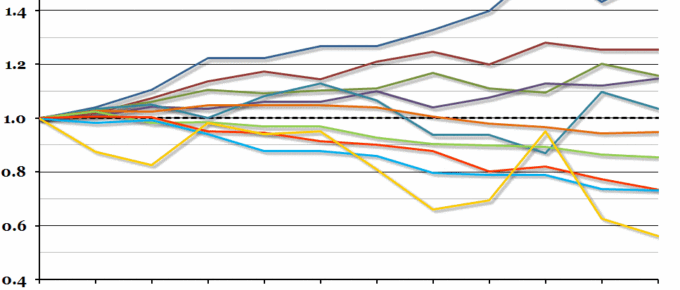
A large quantity of statistics relating to the final quarter of last year were released at the end of last week, and one interesting aspect was that real per capita household spending in 2015 almost returned to the 2007 peak.
Chart of the Week: Week 51, 2013: Historical Household Spending
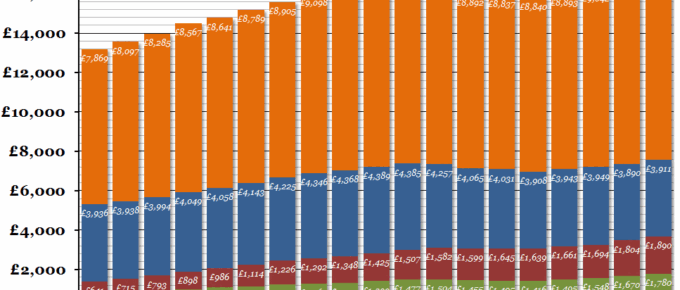
The Office for National Statistics’ annual household spending report came out last week, so this week’s chart is on how household spending has changed over the past decade (just in time for Christmas).


