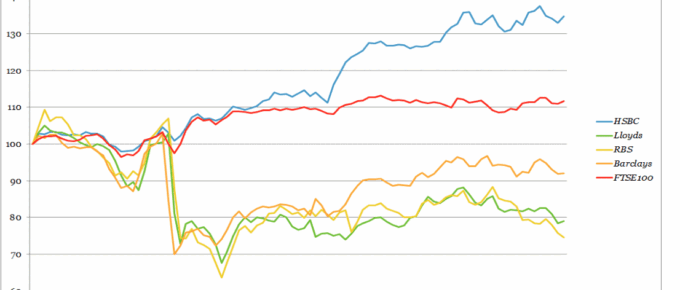
After the collective downturn following the Brexit vote in June (a dramatic 30%), RBS, Lloyds and Barclays share prices have remained well below their pre-referendum rates.
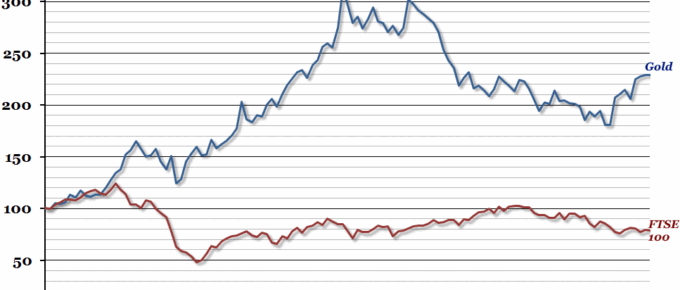
Chart of the Week: Week 33, 2016: Price of Gold vs. Equities
Had they invested in August 2006, investors in Gold have would have received a return of over 100%, whereas investors in UK equities (as measured by the FTSE 100) would have received less than their initial investment.
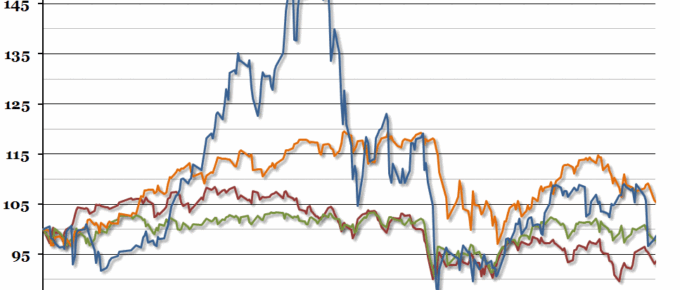
Chart of the Week: Week 1, 2016: Global Stock Markets
While we’ve been away over the Christmas break, global stock markets suffered another shock, which once again originated in China.
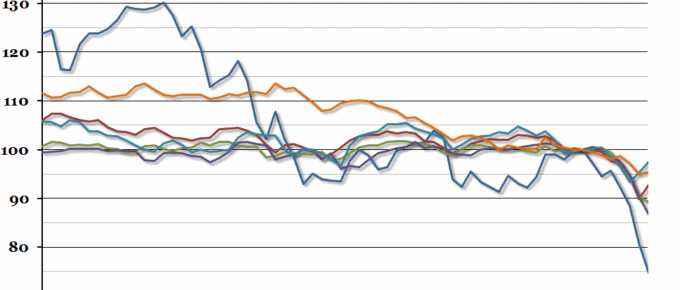
Chart of the Week: Week 34, 2015: Global Stock Markets
Since our chart on Chinese exchange rates last week, the global economic press has shifted focus from the currency to the stock markets.
Chart of the Week: Week 8, 2014: UK Stock Market
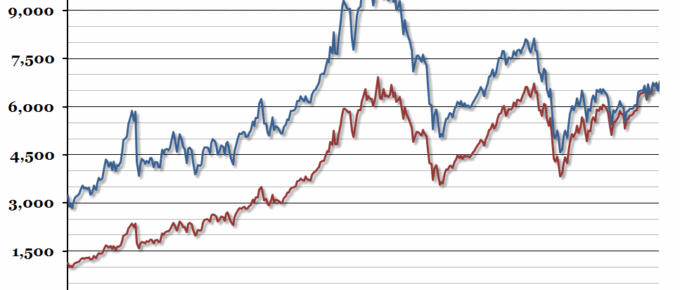
The FTSE is 30 years old this year, so we’ve decided to take a look at its inflation adjusted performance over that time.

