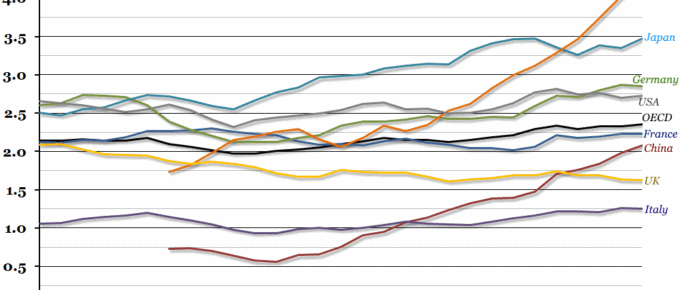
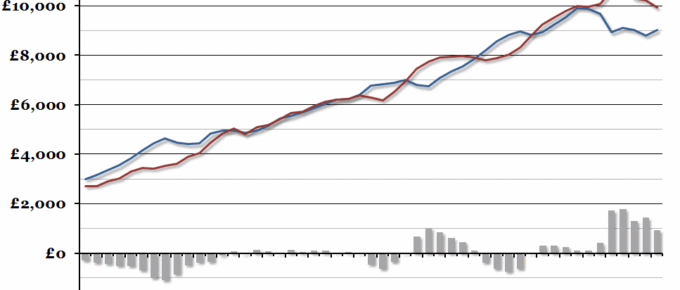
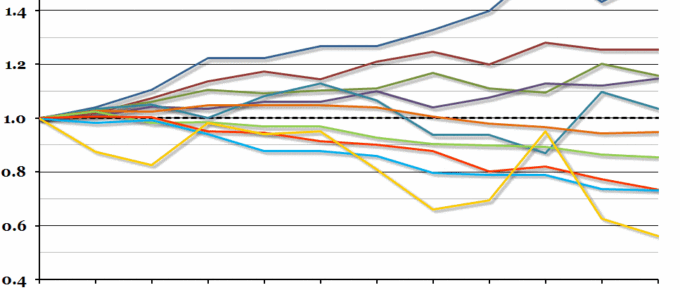
Spending on research and development has been comparatively low in the UK for some time, but it has decreased since the financial crisis.
Chart of the Week: Week 42, 2015: EU Government Finances
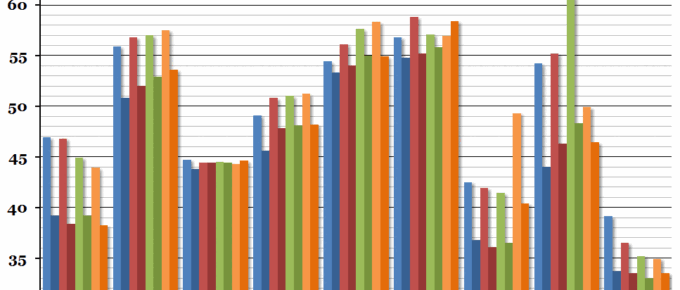
Eurostat announced their updated statistics for European government finances this morning, and the headline figure showed that across the EU, the average deficit improved from 3.3% to 3%.
Chart of the Week: Week 27, 2015: EU Government Spending
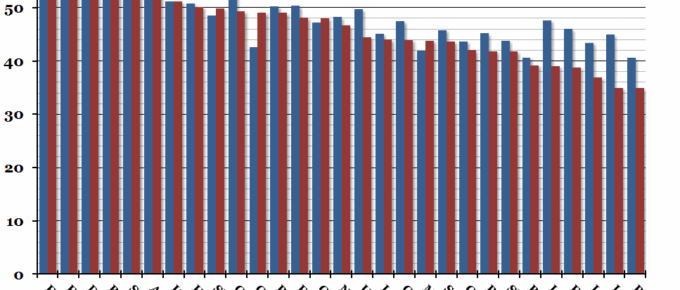
With the UK Budget due later today, this week’s chart compares total government spending, as a percentage of GDP, across all the EU countries.
Chart of the Week: Week 11, 2015: UK Central Government Finances
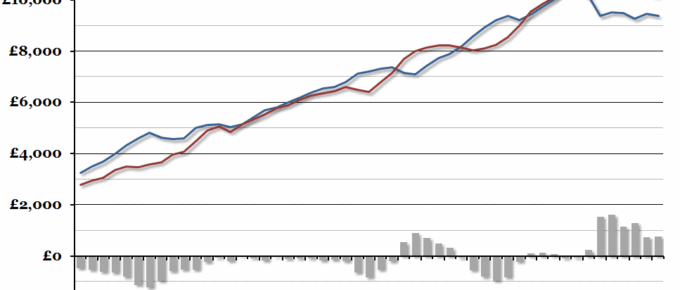
With the annual UK Budget due this afternoon, we’ve updated our yearly chart showing the central government finances per person.
Chart of the Week: Week 12, 2014: UK Government Finances
This afternoon, the Chancellor will present the UK Budget for the coming year.
Chart of the Week: Week 51, 2013: Historical Household Spending
The Office for National Statistics’ annual household spending report came out last week, so this week’s chart is on how household spending has changed over the past decade (just in time for Christmas).

