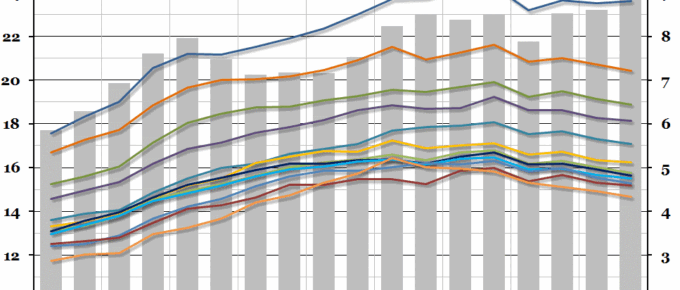
Data released by the ONS this morning showed that the gap in gross disposable income between the richest region of the UK (London) and the poorest (Northern Ireland) opened up to the largest it has been since records began in 1997.
Chart of the Week: Week 44, 2015: UK Household Finances
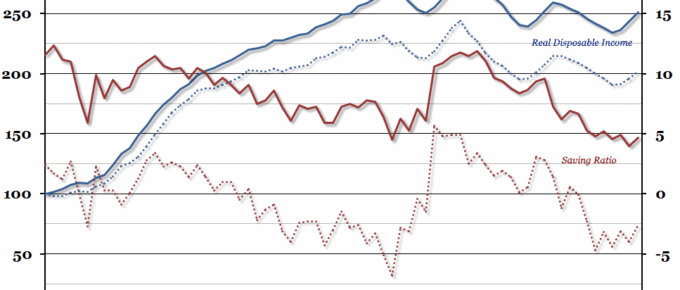
On Monday, the Office for National Statistics issued a revised measure of both real household disposable income and the household saving ratio, which made them seem worse than previously thought.
Chart of the Week: Week 21, 2015: UK Regional Disposable Income
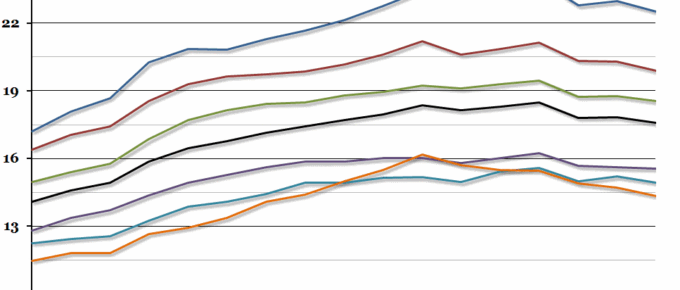
This morning, the ONS released a long-term data series on regional household gross disposable income, which showed that the gap between the richest and poorest regions in the UK had opened up slightly.
Chart of the Week: Week 44, 2013: Household Disposable Income
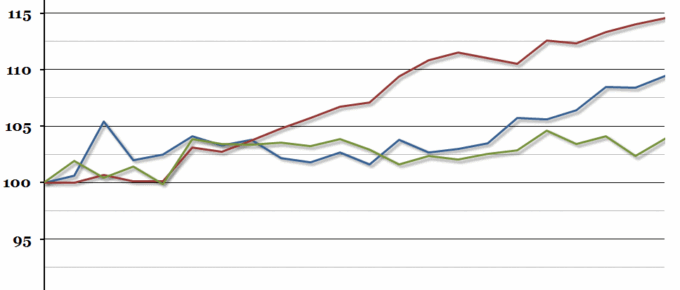
The Office for National Statistics November Economic Review pointed out this week that although we have begun to experience decent economic growth again, there has been very little growth in real household disposable income since the beginning of 2009.


