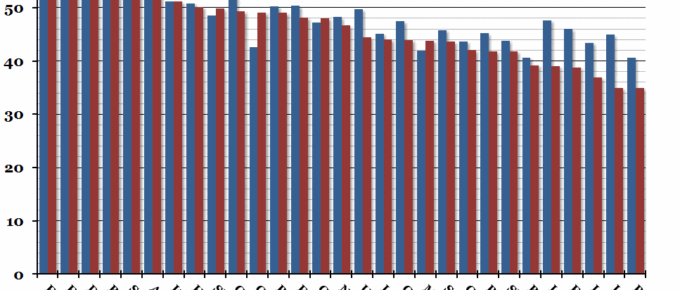
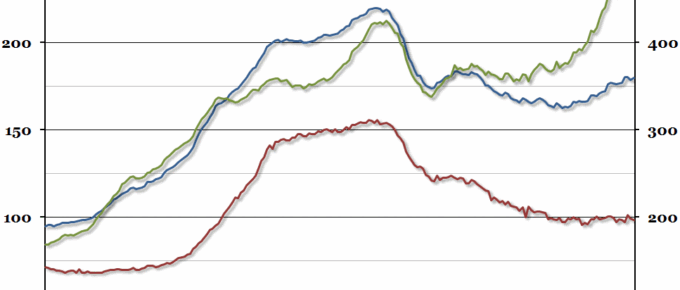
With the UK Budget due later today, this week’s chart compares total government spending, as a percentage of GDP, across all the EU countries.
Latest Blogposts
Chart of the Week: Week 26, 2015: Greek Bank Deposits
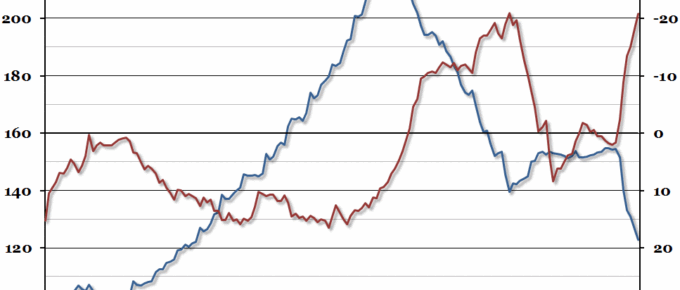
Last week, while discussions over a possible Greek bailout agreement were stalling, the Bank of Greece quietly released their monthly figures for bank deposits.
Chart of the Week: Week 25, 2015: UK Services Growth by Sector
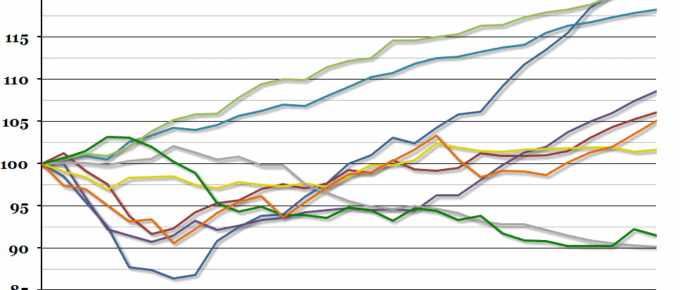
A few weeks ago, we produced a chart which showed how the UK service sector is outperforming other sectors and dragging GDP growth up.
Chart of the Week: Week 24, 2015: Employment and Earnings
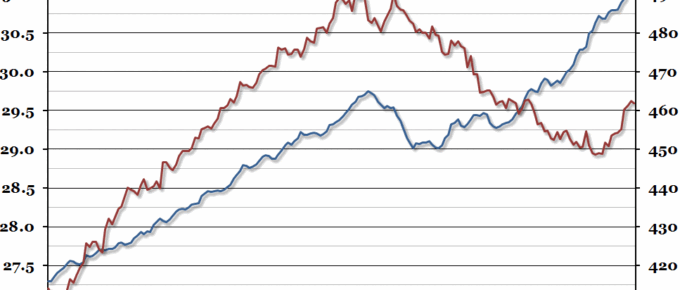
After peaking at a new record level in March, total employment levels fell very slightly in April (but the trajectory remains promising), while real earnings have recovered somewhat in the last year.
Chart of the Week: Week 23, 2015: UK House Prices
The Land Registry published their data on average house prices for April recently, and they showed that although the average price grew by just over 5% in nominal terms, this was the slowest annual growth rate since January 2014.
June 2015
Data gathering technology that is already embedded in your mobile telephone and algorithms could in the near future predict that when you leave a meeting or a restaurant, you will need a taxi to take you to your next destination and it will be waiting ….

