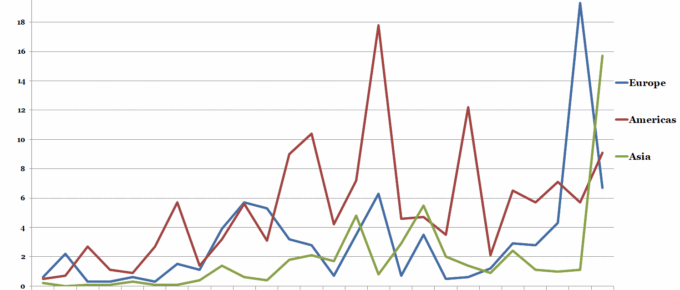
The chart shows that total global investment in fintech companies for the first half of 2018 reached a peak of $57.9 billion, growth undoubtedly fuelled by demographic changes. Europe contributed 45% at $26 billion, with the….
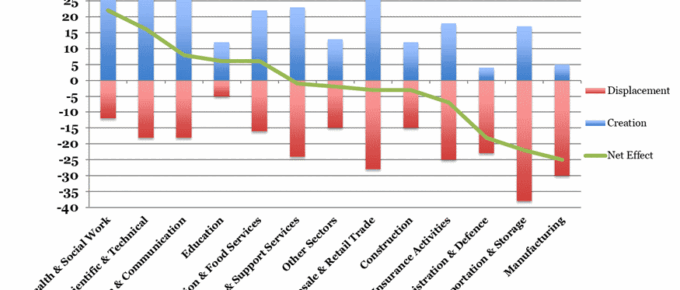
Chart of the Week: Impact of AI on UK Jobs by Sector
Recent advances in artificial intelligence have been incorporating cognitive skills that show potential to supersede human ability. Although the potential is vast, there will be attendant job insecurity in many industries, with many of those laid off lacking the necessary skills to benefit from the jobs AI creates….
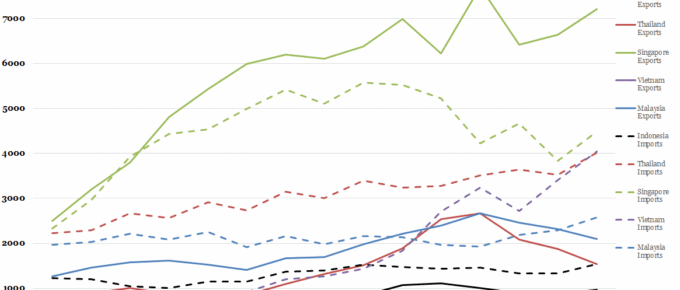
Chart of the Week: Week 36, 2018: Historical UK Trade with ASEAN States
UK’s trade with the selected nations from the Association of South East Asian Nations (ASEAN) has increased, with the values of imports from …
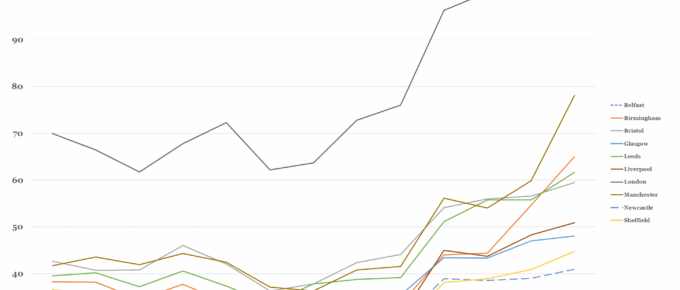
Chart of the Week: Week 35, 2018: Business Start-Ups by City
Since 2011, new business formation has outstripped business closures, with the gap widening until the beginning of 2016…
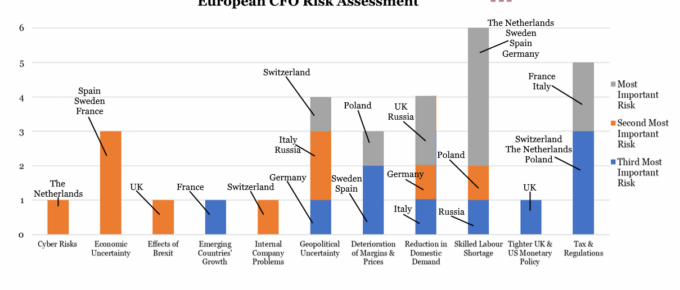
Chart of the Week: European CFO Risk Assessment
CFOs of the largest European nations, excluding the UK, do not express explicit concern about the effects of Brexit…
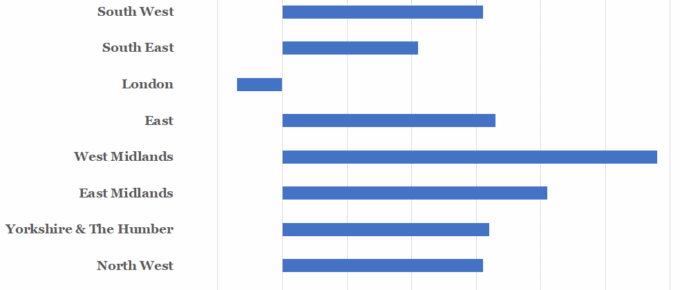
Chart of the Week: Week 33, 2018: House Price Change by Region
London has long been a boon to UK average house price growth, but following a slide sparked by the referendum in summer 2016, growth

