Summary
Fine particles and pollutants in the air resulting from human activity negatively impact our wellbeing, the NHS, and inadvertently the economy. As the consequences of pollution become ever more realised, it’s important to understand the legislation which exists to manage it.
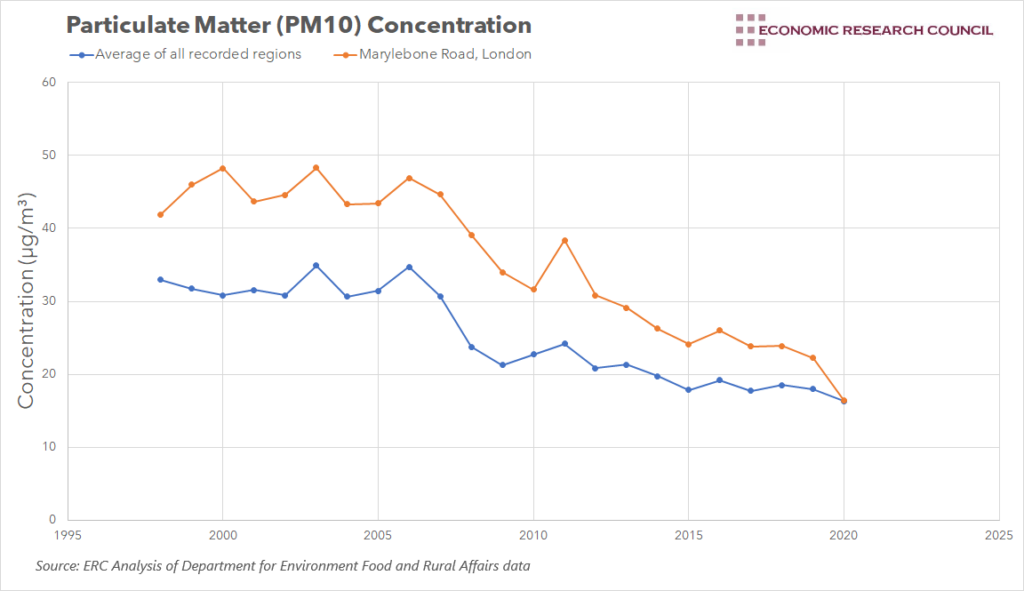
What does the chart show?
The chart shows changes in the average PM10 concentration (particulate matter, less than 10 microns in diameter) in the UK. The red line indicates PM10 concentration in London specifically, whilst the blue line indicates the average across all recorded regions.
Why is the chart interesting?
Particulate matter (PM) encompasses a range of substances and chemicals suspended in the air, many of which are toxic. Half of all UK concentrations of PM come from anthropogenic sources, that is, resulting directly from human activity. This includes dust from construction & demolition projects, wood fires, and even the wear-away of vehicle tyres during braking. Due to the tiny size of the particles that comprise PM, it is easy firstly, to breathe them in, and secondly, for them to enter the bloodstream and build up in vital organs – the Office for Health Improvement & Disparities states that the annual mortality rate from man-made pollution in the UK could be as great as 36,000 deaths per year. An estimate for the total cost to the NHS from air-pollution-related illness between 2017 and 2025 stands at £1.6bn. The Department for Environment, Food and Rural Affairs has even labelled the total yearly economic cost of air pollution as comparable to that of obesity; over £10bn. The cost of poor-quality air extends beyond healthcare too; an analysis by the Confederation of British Industry estimates that up to 3 million work days per year are lost to illness related to poor quality air, and time taken to care for others with health issues.
As such, the 2018 National Emissions Ceiling Regulations require that by 2030, the UK reduces total PM2.5 emissions by 30% relative to 2005 levels. As shown by the chart above, average PM10 air concentration across all regions has steadily declined from 35µg/m³ in 2006 to 16µg/m³ as of 2020 – although a >50% decrease is impressive, 2020’s figure still falls short of the WHO’s Air Quality Guidelines of no more than 15µg of PM10 per cubic metre. London, unsurprisingly, suffers the most as a result of air pollution. 20% of London primary schools are in an area breaching the legal limit for toxic nitrogen dioxide/NO2, and over 9,000 Londoners are estimated to die yearly due to air pollution.
However, The London Environment Strategy, published in 2018, aims to ensure that “London will have the best air quality of any major world city by 2050” through the implementation of a set of new policies and proposals. One such proposal is the London Local Air Quality Management system, whereby boroughs must monitor and report on local air quality, using high-quality monitoring data, funded by the Greater London Authority, Transport for London and London boroughs themselves. This is to better understand the sources of pollutants, and in turn, more effectively adapt them in the future. Far more widely known has been the Ultra Low Emission Zone (ULEZ) project in London, whereby drivers releasing significant emissions must pay a daily fee to drive in the heart of the city. While it’s estimated that ULEZ has led to 13,500 fewer polluting cars being driven in the affected zone, according to research conducted by Imperial College London, any effect on PM concentration has been negligible.
Elsewhere in Europe, however, significant progress has already been made toward achieving clean air. Finland is the world leader in air quality, according to the WHO; with an air PM2.5 concentration of 6µg/m³, largely as a result of the Finnish Ministry of the Environment’s comprehensive
Environmental Protection Act. Whilst the act, in places, focuses on the preservation of biodiversity, it also limits polluters’ activity, by requiring permits for any activities risking pollution of the air, water or soil. Additionally, to disincentivise the use of traditional cars, the Finnish government offer a €2,000 subsidy on the purchase of electric vehicles; part of a bigger plan to reach 250,000 electric cars in Finland by 2030. The scheme has potentially proven its own effectiveness too, as in June 2021, electric car sales outnumbered diesel car sales for the first time in Finland. In a similar manner, the UK has adopted longer-term solutions too; with pledges to phase out all petrol and diesel vehicles by 2030 and for all heavy goods vehicles sold in the UK to be zero-emission by 2040.
By Tyler Boruta


