Summary
The number of people employed by the civil service ballooned after the Brexit vote, reversing a long-term trend of declining staff numbers. However, not all grades were affected equally. Proposed reductions in the number of civil servants must take into account the story of the last ten years to ensure the provision of public services.
What does the chart show?
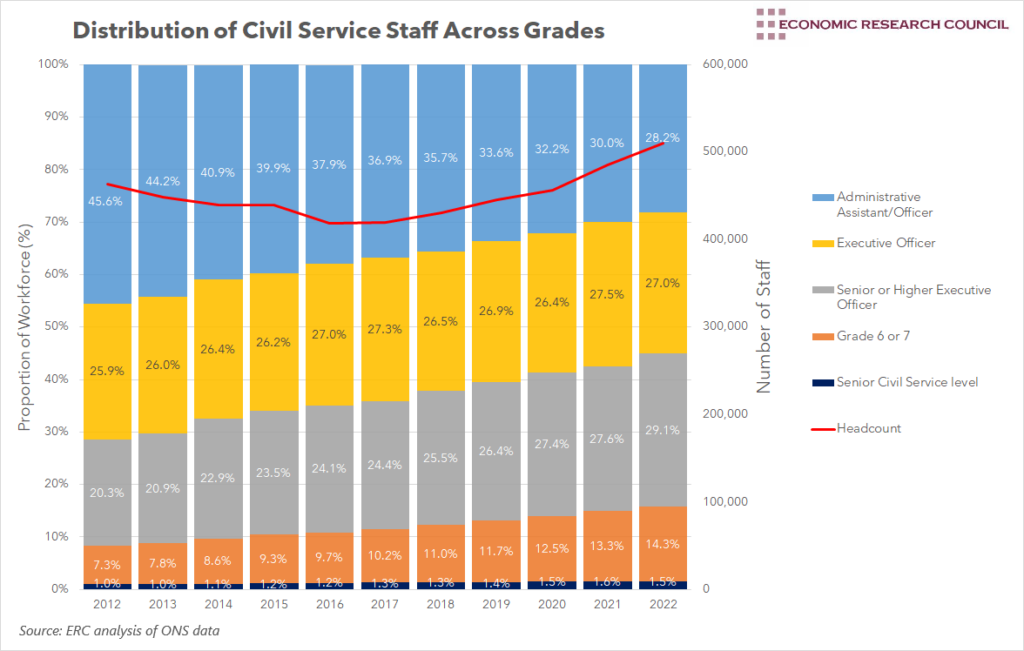
The chart displays the proportion of civil service staff employed in each grade. Grades increase in seniority as you move down the chart. The red line denotes the total number of staff employed by the civil service and is read from the right-hand axis.
Why is the chart interesting?
Civil service reform is a topic that has captured the attention of most prime ministers (if not the general public), eager to boost the efficiency of the machinery of government. The current prime minister is no different and plans to cut 91,000 civil service jobs to save £3.5bn. This week’s chart examines civil service numbers since 2012, scrutinising where the axe has been wielded.
As the chart displays, the civil service saw a general reduction in staff numbers during the years of the coalition, continuing a theme that has been present since it employed its peak of almost 1.2m staff during WWII. This reduction accelerated between the Conservative Party gaining an overall majority and the advent of the Brexit referendum. The vote proved to be an inflection point, with staff numbers rising significantly from 2017 onwards. The civil service headcount rose from 418,000 in 2016 to 510,000 in 2022. Whilst other departments experienced rises, these were concentrated in departments most affected by the UK leaving the EU. The Department for Environment, Food and Rural Affairs took on an additional 3,000 staff in the years after the vote, increasing its number of employees by around 50% between 2016 and 2020, and doubling between 2016 and 2022. By 2020, over all government departments, around 25,000 staff were working on Brexit-related issues.
Whilst the overall headcount provides some useful analysis, assessing the distribution of civil service staff presents interesting implications for the provision of services. On this front, the chart presents fascinating, yet worrying insights. Since 2012, the civil service has become more and more senior when comparing the ratio of grades. The proportion of staff holding Executive Officer or higher roles increased from 54.4% in 2012 to 71.8% in 2022. The proportion in junior roles has fallen each year since 2012 when it stood at 45.6%. The proportion in senior roles (grade 7 or above) has almost doubled in this time, rising from 7.3% to 14.3%.
On its own, the above portrays nothing other than the structure of the civil service. However, this structure is crucial when considering the delivery of public services. Departments that deliver more frontline public services tend to have a higher proportion of junior grade workers. The Department for Work and Pensions has the highest proportion of workers at the Executive Officer level and below, with 82.5% of their workforce falling into that category. Conversely, the Department for Culture, Media and Sport, which deliver far fewer frontline services, have the highest proportion of Senior/Higher Executive Officer and above roles, with over 90% of their staff falling into this group.
As such, over the last 6 years, we’ve seen an increase in civil service staff numbers, concentrated in higher roles, whilst subsequently experiencing a decline in the proportion and the absolute number of civil service staff working in frontline roles. This is extremely likely to have had an impact on the quality of the provision of public services.
As we move out of the shadow of Brexit, the need for the inflated civil service should dissipate. Plans are already afoot to reduce civil service numbers by 91,000 staff. Senior officials have already suggested these cuts cannot be made without impacting public services. As inflation bites and recession looms, the delivery of public services will become ever more crucial, particularly to a specific subset of society. If these cuts do go ahead, their focus should be on higher-ranking positions to mitigate the effect on public services.
By David Dike


