Summary
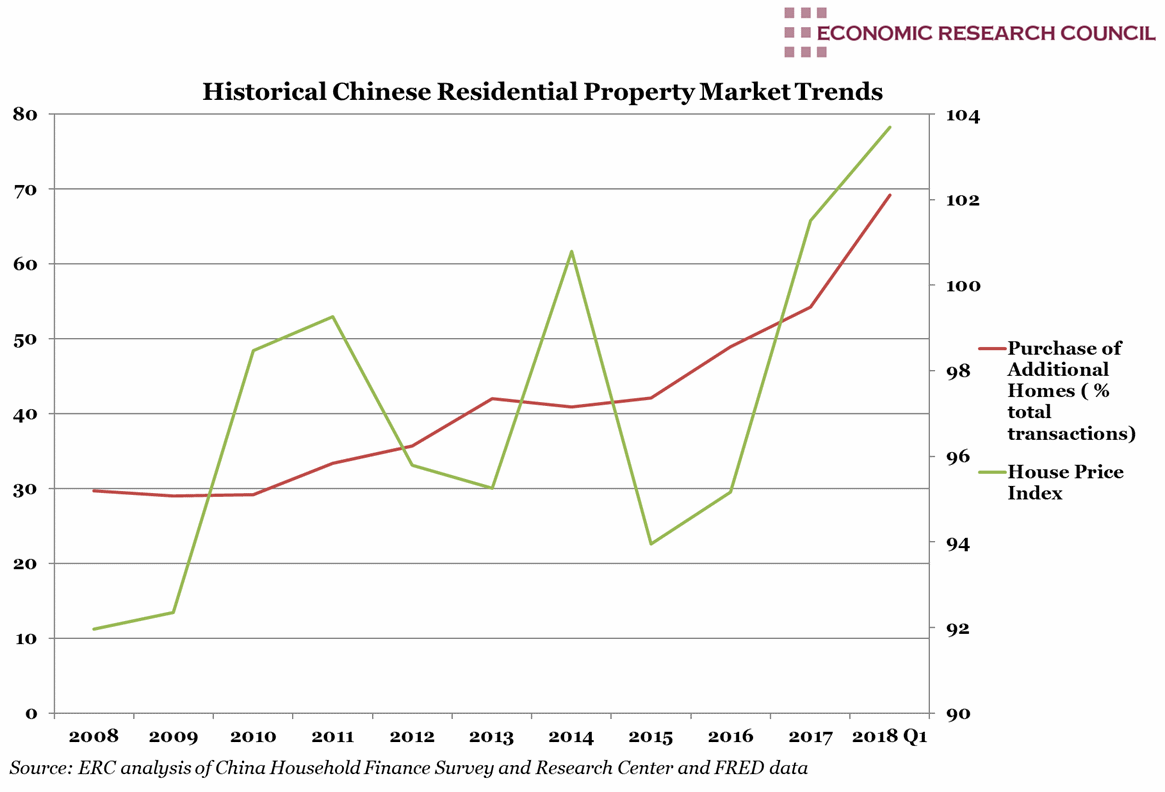
The chart shows that there has been a relatively rapid increase in the purchases of additional homes in mainland China. This is coupled with an increase in house prices, which appear to be correlated with the increase in purchases of new homes by investors already in possession of one or multiple housing properties. Since 2008, the relative proportion of first time homebuyers to multiple time home buyers in the market for housing has inverted (from 70% first time in 2008 to 70% multiple time in 2018). During data collection for this chart, there was little indication that total home sales had decreased, rather that multiple time buyers have been purchasing an increasingly large proportion of properties. Among these buyers, the largest growth in new purchases has been by those who already own two or more properties. In fact, buyers such as these increased more than threefold from 7% of the market in 2015 to 25% in 2018. Rising prices have pushed aspiring middle classes wishing to move into urban areas towards unaffordable credit. When combined with increases in speculation, projections are now that by 2020 the Chinese mortgage debt to household income ratio will match that of the USA’s in 2007 on the eve of the housing crisis.
What does the chart show?
The red line on this chart shows the percentage of new houses purchased as additional homes, measured on the left-hand axis. ‘Additional’ refers to households or investors who already own one residential property and are buying their second, third, or more. The green line plots the Chinese House Price index, between 2008 and the start of 2018, measured on the right-hand axis. The increase in residential investment has been accompanied by a substantial housing price increase, reflected by the Chinese House Price Index, which rose to 103.7 in 2018.
Why is the chart interesting?
It would be unremarkable were house prices increasing as a function of total home purchases, however, this graph shows that the key driver of HPI rises is not the fundamental demand for housing. Rather it is in response to increased purchases of multiple residential properties, reflective of increased speculation. This is further evidenced by the reports of vacant urban housing, accounting for as much as 22% of all urban housing, according to recent estimates (over 50 million homes).
Such a substantial number of vacant (and therefor more liquid) assets would likely be unloaded very quickly in the event of a downturn, causing property markets to spiral. Any such crash would have an enormous impact as home equity constitutes by far the largest proportion of average Chinese household wealth, between 60 and 70% versus c.20% in the US.
Price growth has priced many first time home buyers of the market, despite rising incomes. From mid-2015 through to December 2017 house prices rose 31%. The median price per square foot is now 38% higher than in the United States, despite the U.S.’s large advantage in average income. This is another indication that fundamental demand for housing among the vast majority of the population has not increased.
Increasing pressures on the margins of residential developers, including rising costs of both land and construction materials, have left them no choice but to sell at very high prices to the detriment of first time buyers. Governments at the local and national level have been attempting to use a variety of measures to slow down housing market growth, to varying degrees of success. However, fear of a housing crisis abounds.
At the local level, many provincial and city governments have an issue of strategic interdependence. Should they decide to pursue monetary tightening, they may see investment shift in large quantity to neighbouring competing regions. Accordingly, many are reticent to implement property taxes to discourage vacant housing. Many have also restricted housing supply in order to keep prices high while also hampering further growth. This has maintained inaccessibly high prices and has been ineffective in slowing down new investment, both from developers and speculators. Cities such as Beijing have attempted to increase down payment requirements for the purchase of additional residential properties to almost 80%. However, development has been increasing regardless. 2018 residential investment is up by 14% and mortgage growth at 20%. Purchasing restrictions for multiple home buyers are being tested, but so far with limited effect, as shown by the chart. Loan-to-value ratios have also increased, but many consumers are able to circumvent this by taking out commercial or shadow loans to finance housing purchases.
Instead of reducing lending, many banks have attempted to deleverage using asset backed securities. Many fear that the rapid increase in issuances of complex ABS bonds constitutes a considerable risk in itself. According to Bloomberg, many banks are compelled by central government to increase lending to stimulate growth, leading to not only an increase in leveraging but causing bond issuances to reach a record $44 billion this year. In 2018, mortgage backed securities have made up 60% of new bond issuances, up from 6% in 2015. This echoes the chart indication that increases in new home purchases have been a function of speculative leveraging. This year, the Bank of China has been steadily decreasing its required reserve ratios as part of the effort to stimulate lending. Although concerning, there is consolation in the fact that, unlike in the U.S. in 2007, speculators make up a larger factor in housing price growth. Speculators, contrary to subprime borrowers, are more likely to have large amounts of capital and strong credit histories.
Week 48, 2018


