Summary
The public sector finances for the financial year 2015/16 were recently released, showing that Public Sector Net Borrowing (excluding publicly owned banks) fell to £74bn (from £91.7bn in 2014/15). In light of the new data, we’ve updated our historical UK government debt graph from last year.
What does the chart show?
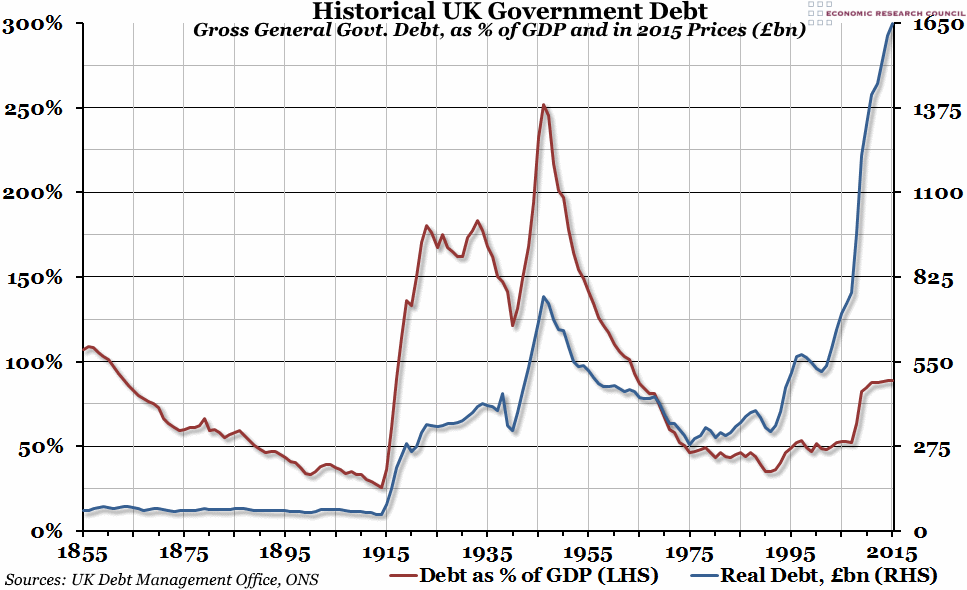
The chart shows the level of gross debt held by general government (central government plus local governments) in the UK. The red line, measured against the left hand axis, shows debt as a percentage of Gross Domestic Product. The blue line, measured against the right hand axis, shows real debt levels in 2015 prices (that is, allowing for inflation using historical CPI) in billions of pounds. Please note that general government gross debt is not the preferred method of measuring public debt – that is Public Sector Net Debt – but it is the best historical data we have available.
Why is the chart interesting?
While net borrowing is positive (that is, we are running a government budget deficit) and inflation is near zero, real debt levels will continue to rise, and this is what we saw in 2015/16. Real gross general government debt rose to just under £1.65 trillion by March 2016 – an increase of almost £50 billion on the same time last year. In real terms, this is far higher than it has ever been before. However, that doesn’t take into account our increased wealth and ability to pay back that debt, represented roughly by GDP (an alternative measure could be government receipts, but long-term data on this is harder to find). As a percentage of GDP, government debt has been broadly flat for the last five years, at around 88%. This is high compared to the last forty years or so, but it has been higher before.
At the moment, with rock bottom borrowing costs for the government, this debt is not a major problem. While the real interest rate on short-term borrowing is negative, the burden of interest payments remains small. However, these conditions are unlikely to last forever, and ultimately the question of how to reduce the total level of debt will have to be answered. In the past, successive governments have mostly relied on inflation to reduce the value of their real debt (nominal debt has only fallen in 24 out of the last 100 years, and 8 out of the last 50). That is still the easiest option, but inflation may remain stubbornly low for the near future.

