Summary
Spending on research and development has been comparatively low in the UK for some time, but it has decreased since the financial crisis. This puts us at an economic disadvantage, and it is something that the Chancellor should address in his Autumn Statement.
What does the chart show?
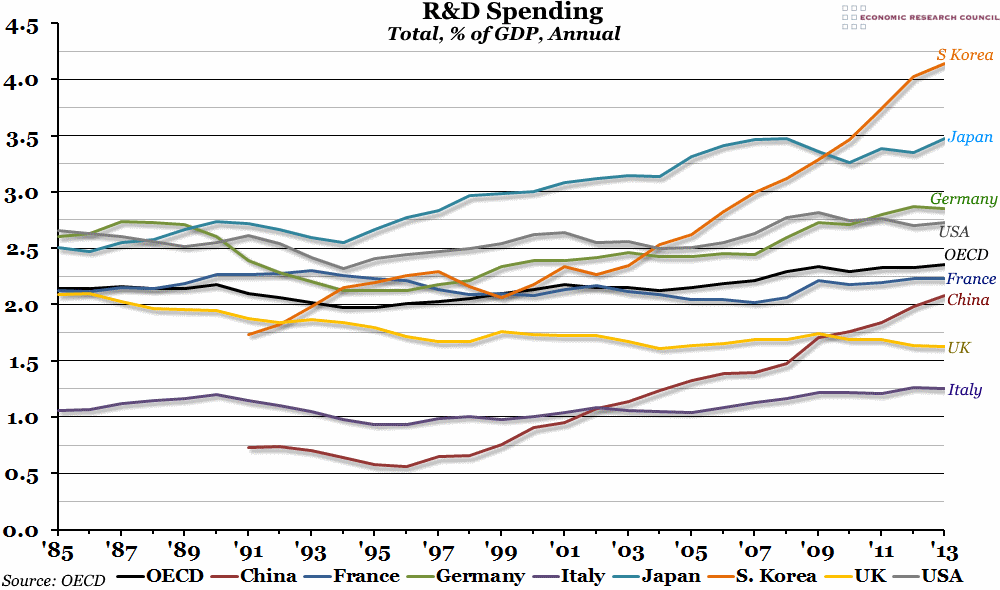
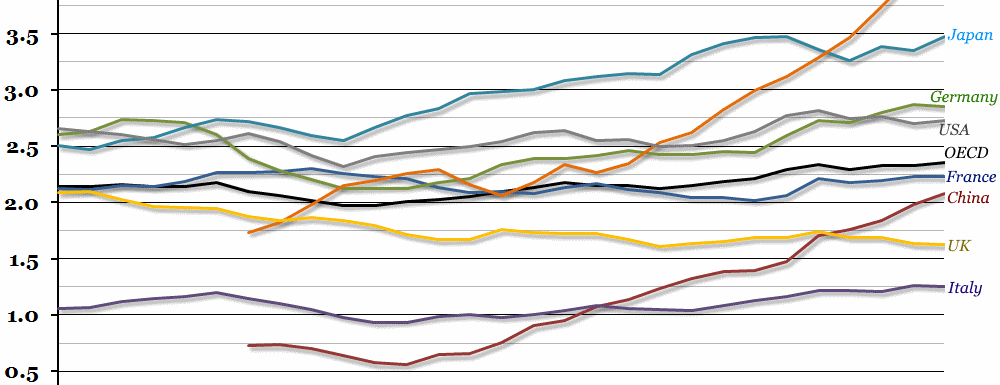
The chart shows total annual spending on research and development as a percentage of national GDP for a selection of countries (and the OECD average). 2013 is the latest figure available for most countries from the OECD.
Why is the chart interesting?
Total spending on R&D in the UK is both historically low – spending levels in 2013 returned to the levels of the previous low in 2004 – and low compared to our economic competitors. Spending on research was similar in the UK to the OECD average back in 1985, before it went on a long decline, which was only really arrested between 2004 and 2009. However, since then, it has been decreasing again, and is looking increasingly weak compared to other advanced economies. For example, both Germany and the USA have consistently spent around 2.75% of their GDP on R&D since the economic crisis (an increase on the pre-crisis years), while France has maintained theirs at around 2.25%. Spending on R&D in both South Korea and China has increased significantly over the past 15 years, while of the G7, only Italy has had consistently lower spending (and even theirs is increasing).
This chart measures both public and private spending on R&D, so it is not just a problem with government spending, but the impetus and incentives to encourage such spending should be part of any government plan to improve productivity, which must be a top priority.

