Summary
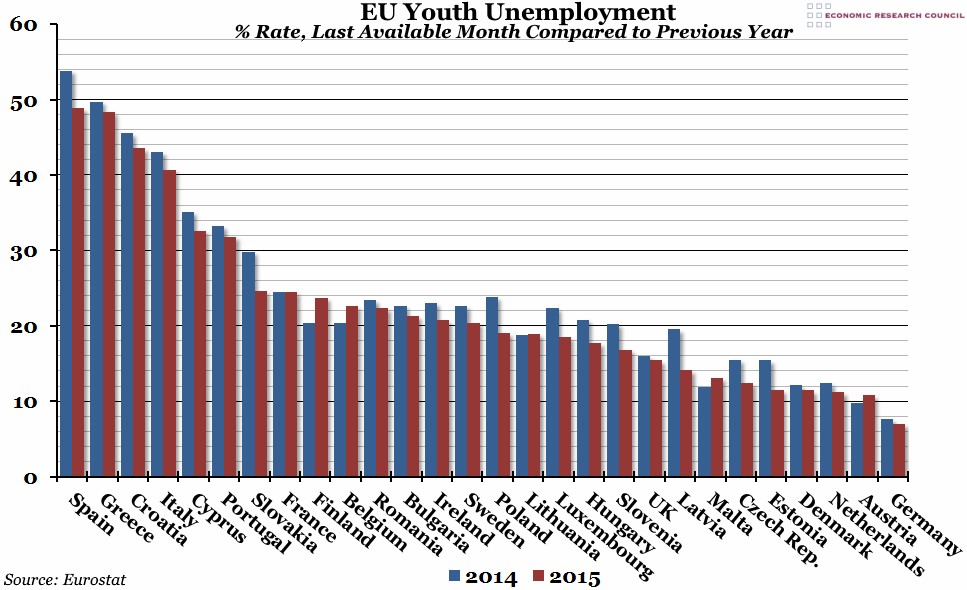
European unemployment figures were released by Eurostat this morning, and showed a continuation of the downward trend in the aggregate EU unemployment rate. While youth unemployment dipped below 50% for every single EU country for the first time since November 2011, it remains a crucial issue for a number of European economies.
What does the chart show?
The chart shows the youth unemployment rate (in %) for each of the 28 EU countries. The red bar shows the latest available monthly figure (August 2015 for most of them; July for Estonia and Hungary; June for Greece, Croatia, Cyprus, Romania, Slovenia, and the UK). The blue bar shows the figure for the same period a year ago. Eurostat defines the youth unemployment rate as the percentage of the labour force aged between 15-25 (ie. all those in work or currently looking for work) who are currently unemployed.
Why is the chart interesting?
In 22 of the 28 EU countries, youth unemployment rates fell between the summers of 2014 and 2015. The exceptions were France, Finland, Belgium, Lithuania, Malta, and Austria, and while the first three of those countries have youth unemployment rates of over 20% (and a number of other economic troubles as well), the latter two remain firmly at the better end of this week’s chart despite the increase. The big news this month was that, for the first time since the end of 2011, no EU country had a youth unemployment rate of over 50%. For the past 4 years, more than half of the under-25s in at least one of Greece, Spain, or Croatia were looking for work but unable to find it. Youth unemployment is more damaging than other forms of unemployment because it can leave a lasting legacy on an economy, so while the latest improvements in the figures are very welcome, there is still a long way to go before this particular crisis is over.

