Summary
Over the last couple of weeks, there has been a lot of coverage of the devaluation of the Chinese currency. Although it is a very sharp correction, it looks like a return to normal for an artificially overvalued currency, rather than a competitive devaluation that might prompt retaliation.
What does the chart show?
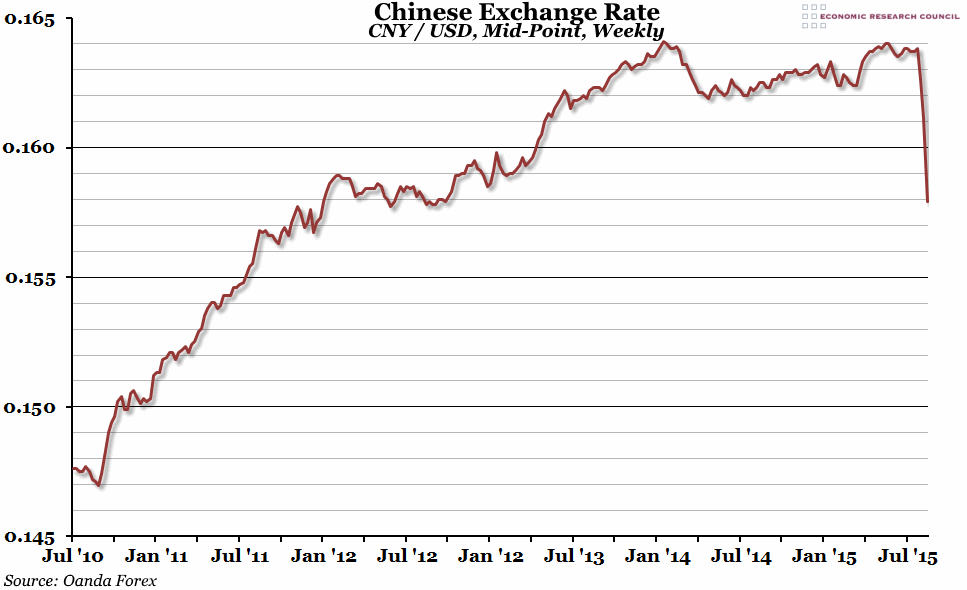
The chart shows the average weekly midpoint price (the price halfway between the “buy” and “sell” prices) of the Chinese Yuan Renminbi (CNY) against the U.S. Dollar (USD). This is the amount of dollars that can be bought for 1 yuan.
Why is the chart interesting?
The last two weeks have seen very steep depreciations in the Chinese yuan, and this has prompted accusations that the Chinese government is devaluing the currency on purpose in order to temporarily boost their economy. The fear is that this will lead to a currency war, where everyone tries to push the value of their currency down, ultimately threatening world trade and prosperity. It is hard to imagine that the decision to devalue now has nothing to do with the poor Chinese export statistics announced a few weeks ago. However, the Chinese have ambitions for the yuan to become an IMF reserve currency (alongside the pound, the dollar, the euro, and the yen), and to do that they need to move from their current “loose peg” system to a fully free floating currency. Bearing in mind that the CNY has been kept artificially high for a number of years in order to boost the international purchasing power of their growing middle classes, any transition to a free floating currency is always going to involve a devaluation, in the short-term at least. This is therefore not an unreasonable step towards that ultimate goal, although the timing is no doubt particularly helpful to waning Chinese exports.

