Summary
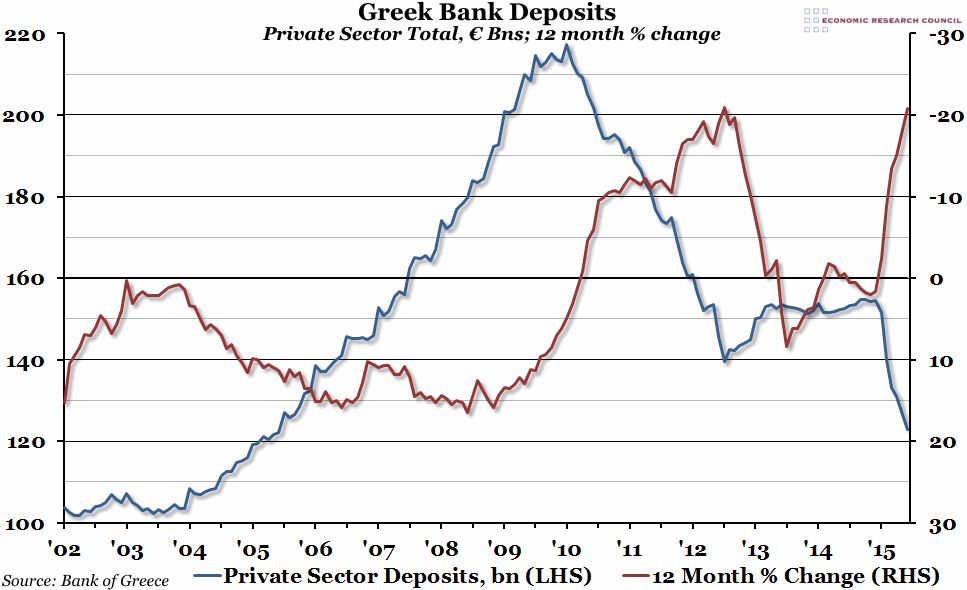
Last week, while discussions over a possible Greek bailout agreement were stalling, the Bank of Greece quietly released their monthly figures for bank deposits. They showed that at the end of May, total private sector deposits had fallen to just over €120bn, and are certainly now much lower than that.
What does the chart show?
The blue line shows the total level of private sector deposits (for both households and corporations) in all Greek financial institutions (excluding the Bank of Greece), in billions of euros, measured against the left hand axis. The red line shows the year-on-year percentage change in the level of those deposits, measured against the inverted right hand axis.
Why is the chart interesting?
The “Greek Crisis” is really made up of two different, but connected, crises. The most obvious is the political crisis surrounding Greek government debt (which came to a head last night as they missed a payment of €1.6bn to the IMF), but in the background a banking crisis has been slowly gaining speed. As the chart above shows, since the beginning of the year more than €30bn has been withdrawn from Greek banks as confidence in a political resolution has faded, prompting the Bank of Greece to appeal to the European Central Bank’s Emergency Liquidity Assistance scheme for help. This scheme is usually freely available to national banks, up to a limit of €2bn, after which special arrangements have to be put in place. Last week, the ECB capped the Greek ELA allowance at €89bn.
This week, capital controls have been put into place in Greece, limiting withdrawals to €60 per day. This will help stop the flow temporarily, but unless a solution to the political crisis is found that the Greek people have confidence in, it will prove very difficult to remove those capital controls without prompting a total collapse of the Greek banking system. As it stands, there have been rumours that a number of Greek banks will go under before the end of the week even with capital controls in place. When you look at how much money has left the system (and remember, this chart doesn’t include withdrawals in June, which would certainly have been larger than the €3.6bn taken out in May), that is very easy to believe.

