Summary
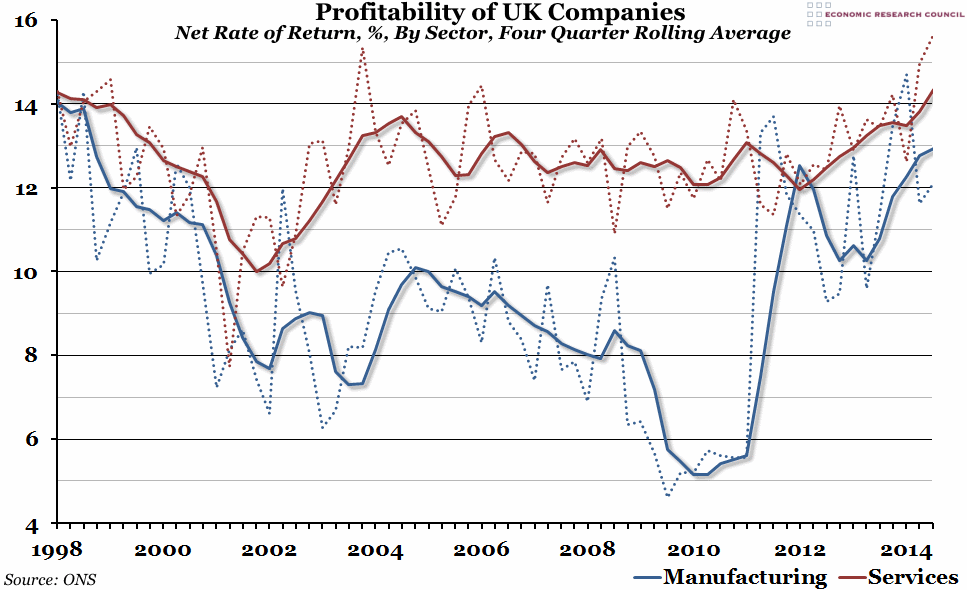
The non-financial services sector set a new record for profitability in the second quarter of 2014, continuing the strong services recovery since 2011. However, the profitability of the UK manufacturing industry has also been growing quickly recently, and after a record quarter at the end of 2013 is now at the highest four-quarter average since 1998.
What does the chart show?
The chart shows the profitability (net rate of return) of all private non-financial corporations in either the services sector (in red) or the manufacturing sector (in blue). The solid lines are the average of the previous four quarters, while the dotted lines show the quarterly data (which can be somewhat volatile). The net rate of return is the ratio of the operating surplus to the capital employed (net of capital consumption), as a percentage.
Why is the chart interesting?
Profitability in the services sector stayed relatively steady from the mid-2000s until the end of 2011, when it hit a minor trough (the only time when the manufacturing sector has overtaken the services sector in four quarter average profitability). Since then, the net rate of return has been growing steadily, with the last quarter (Q2 of 2014) representing the best rate on record (ie. since 1997). On the other hand, the manufacturing sector was experiencing declining profitability even before the financial crisis in 2008, and it was further affected by the crash itself. After a strong recovery at the end of 2011, there was another mini-decline (a reflection of the UK economy as a whole), before another recovery over the past year or so. A single quarter record was set in the final quarter of 2013, and the four quarter rolling average is now at the highest point in sixteen years.
This is in stark contrast to both productivity, which remains weak, and average earnings, which new statistics out today suggest grew by a record low 0.1% in the financial year 2013/14.

