Summary
This morning, official trade statistics were released for 2013, which included details on the top import and export markets for the UK, and what commodities are traded.
What does the chart show?
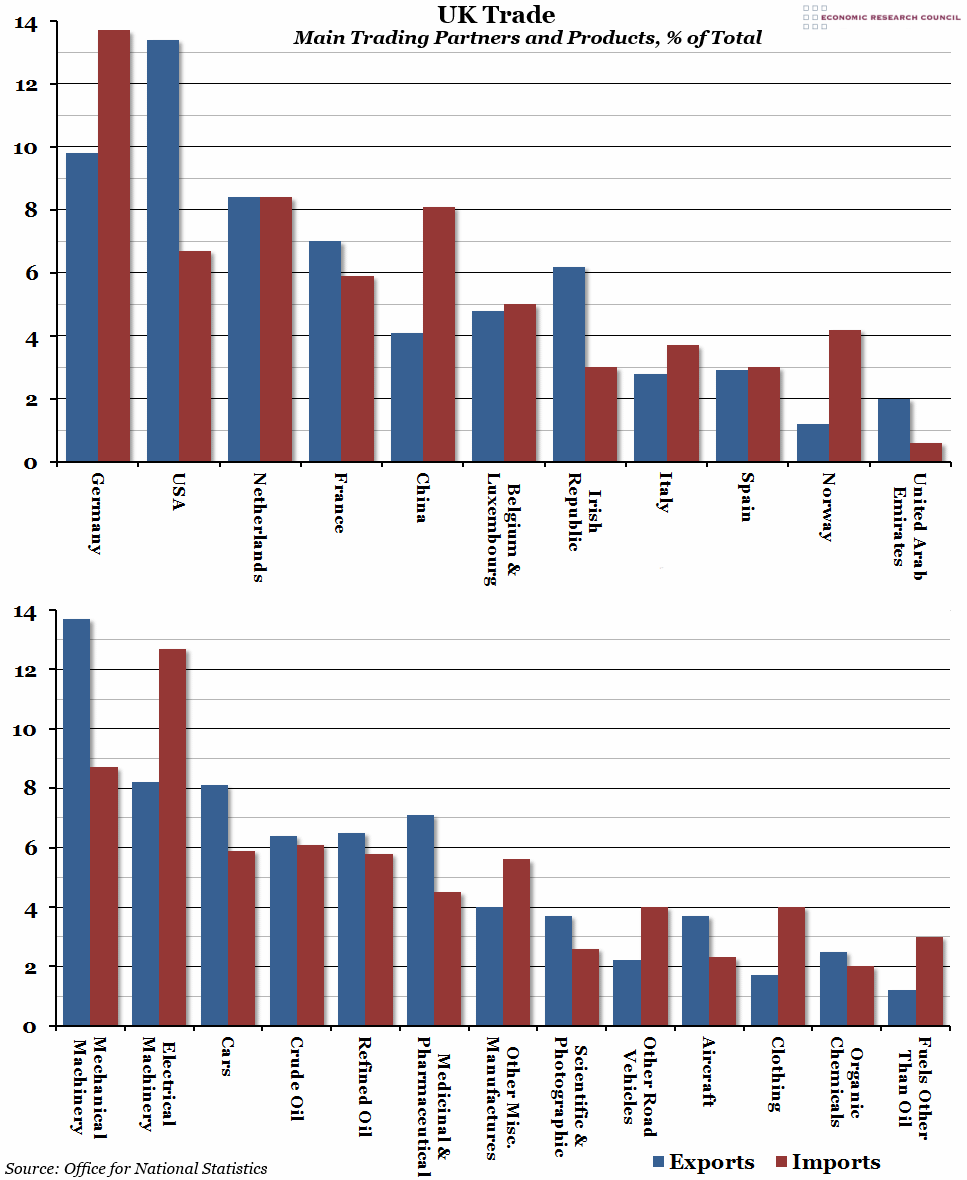
In the top chart, the blue bars represent what percentage of total exports from the UK are sold to each of the 11 listed countries, with the red bars representing the same for imports into the UK. Only goods are included – these numbers do not include international trade in services. We have chosen to include the top ten countries the UK exports to and imports from. Nine countries appear on both lists, with Norway and the United Arab Emirates only appearing on one each (hence the eleven countries listed). The bottom chart shows the same thing, but for commodities; again, the top ten imports and exports were chosen, with only seven appearing on both lists this time (aircraft, scientific and photographic materials, and organic chemicals only appear on the export list, while clothing, other road vehicles, and fuels other than oil only appear on the import list).
Why is the chart interesting?
Most of the included countries are either our neighbours (Ireland, France, the Netherlands, Belgium and Luxembourg, Norway, Spain, Italy) or are major world economies (USA, China) or both (Germany). The United Arab Emirates are a surprise inclusion, especially as one of only three of the listed countries with which we have a trade surplus (countries that we export more to in value terms than we import from). The USA and Ireland are the other two; while it looks like we have a trade surplus with France, the fact that we import more than we export in general means that we pay more for all our French imports than they pay for all their British exports.
The bottom chart shows clearly where the UK’s strengths lie – mechanical machinery represents a big surplus, as do cars and aircraft. Medical and scientific goods also produce a trade surplus. Electrical machinery, miscellaneous manufacturing and clothing represent big deficits, while the UK has a small trade deficit in value terms in both refined and crude oil.
Of course, it should be remembered that these graphs don’t include services, which the UK is a major exporter of.

