Summary
Following on from our chart last week on underemployment, this week we looked at the interaction between recent graduates and young non-graduates in the labour market, courtesy of a recent ONS report.
What does the chart show?
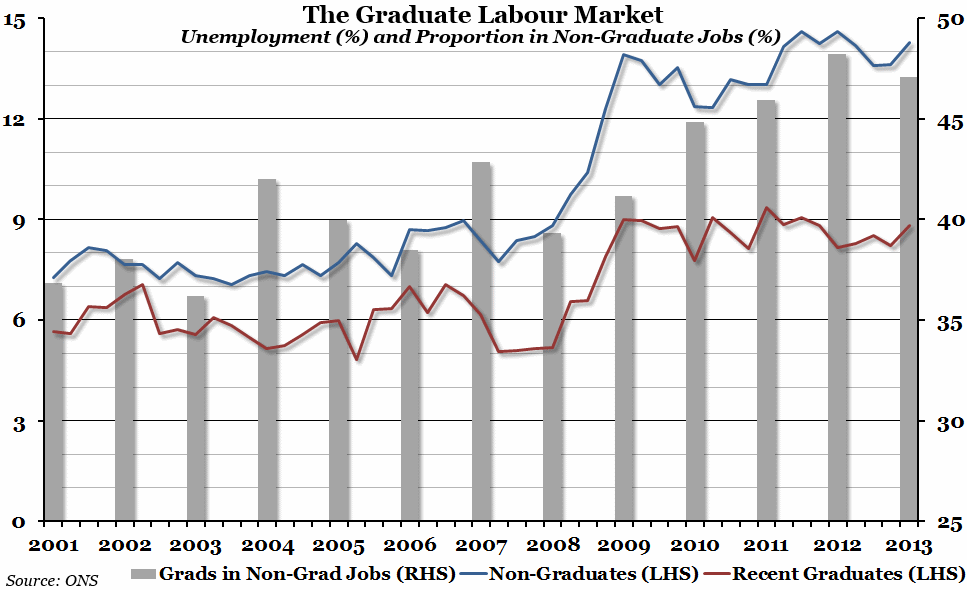
The red and blue lines show the unemployment rate (the percentage of people within a group that are looking for work but cannot find any) for recent graduates and young non-graduates respectively, measured against the left hand axis. Recent graduates are defined as anyone over 20 who has left full-time education within the past 5 years and who has a level of higher education above A Level standard. Young non-graduates are people aged between 21 and 30 who have not completed a level of education above A Level standard. The grey bars, measured against the right hand side, shows the percentage of recent graduates who are working in “non-graduate jobs”, defined as one which does not require a higher educational background.
Why is the chart interesting?
As you can see from the graph, young non-graduates have fared much worse in the labour market since the recession than similarly aged graduates, although the unemployment rate has increased for both groups. Part of the explanation for persistent extremely high non-graduate unemployment might come from the proportion of graduates taking traditionally non-graduate jobs, which has risen over the past decade from just over 35% to over 45% of all recent graduates. This rise began while economic times were good (presumably due to an increasing supply of recent graduates as more and more people went to university) and initially had little effect on the non-graduate employment rate as non-graduate jobs were in ready supply. However, once the labour market began to dry up, the number of jobs on offer fell and non-graduates began to feel the effects.
Also of interest in the ONS report was the data on the employment rate and average earnings by main undergraduate degree. Perhaps unsurprisingly, the top subject for both employment potential and earnings is medicine (and the category of “subjects relating to medicine” is not far behind), but second on employment rate is the much-maligned “Media and Information Studies” – although it should be noted that media studies graduates ended up earning the least on average!

