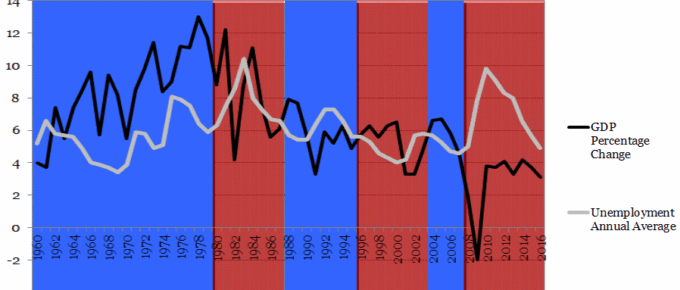
The chart shows that with the exception of 2 occasions, each time the incumbent was ousted at general election, GDP had fallen in the year prior.
Chart of the Week: Week 44, 2016: Government Spending on Education v.s. Labour Productivity
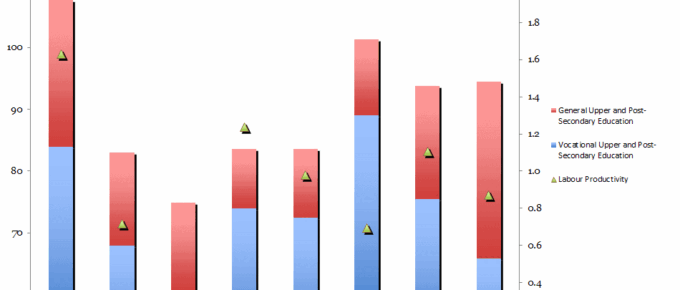
The chart shows that the UK, when compared to other EU countries with strong economies, has one of the lowest levels of spending on vocational education as a percentage of GDP (under 1.5%).
Chart of the Week: Week 43, 2016: Freight Methods of UK Goods Exports to non-EU World
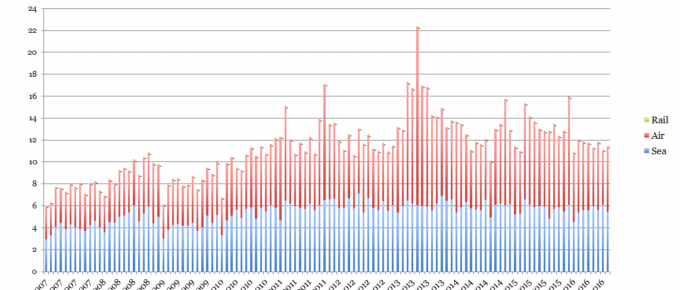
The chart shows that the value of sea freight is at a stable level, remaining fairly constant over the last decade.
Chart of the Week: Week 42, 2016: Inflation vs. Earnings
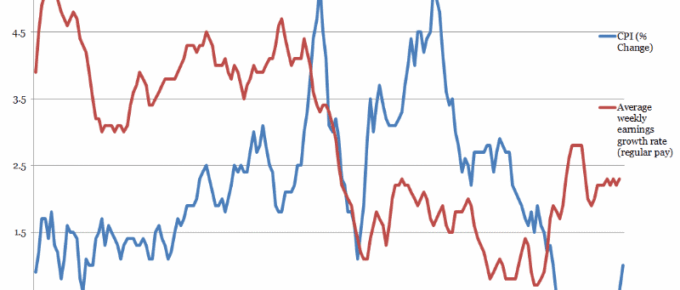
The latest ONS figures, released yesterday show that inflation seems to be in the initial phase of converging with wage growth, currently at a tolerable level.
October 2016
For the last twenty years, we have been living in a period during which a generation has forgotten that debt has to be paid down and debt destruction, often discussed and experienced in the last century, has been forgotten about. This …
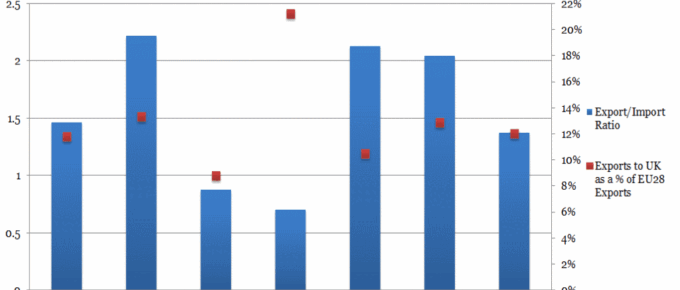
Chart of the Week; Week 41, 2016: EU Nations’ Reliance on Trade with the UK
The chart shows some aspect of each nation’s position on trade with the UK in the run up to Article 50 negotiations with access to the single market being the key issue.

