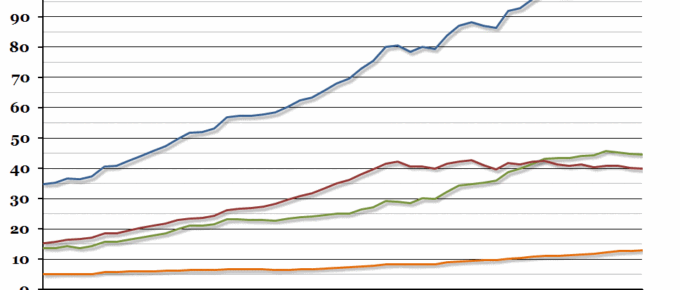
This week, the Bank of International Settlements published their Quarterly Review, which included an interesting chart showing the estimated level of outstanding global debt.
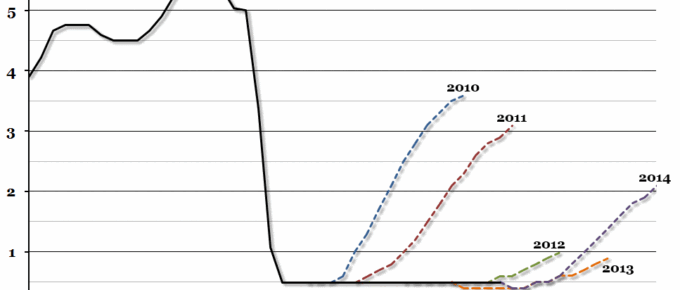
Chart of the Week: Week 10, 2014: UK Interest Rates
Exactly five years ago today, the Monetary Policy Committee of the Bank of England voted to lower the Bank Rate to 0.5%.
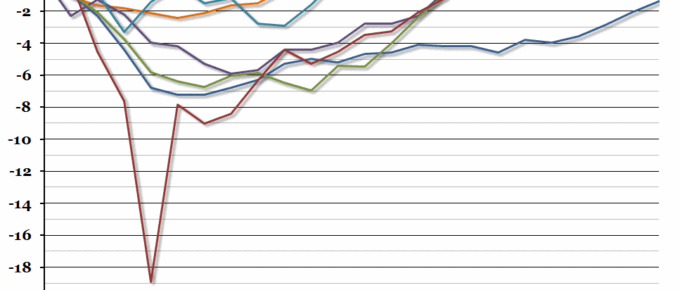
Chart of the Week: Week 9, 2014: UK Recessions and Recoveries
he ONS released their second estimate for Q4 GDP growth today, and it remained at 0.7%.
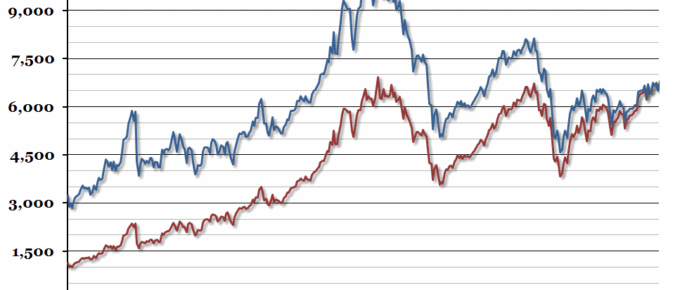
Chart of the Week: Week 8, 2014: UK Stock Market
The FTSE is 30 years old this year, so we’ve decided to take a look at its inflation adjusted performance over that time.
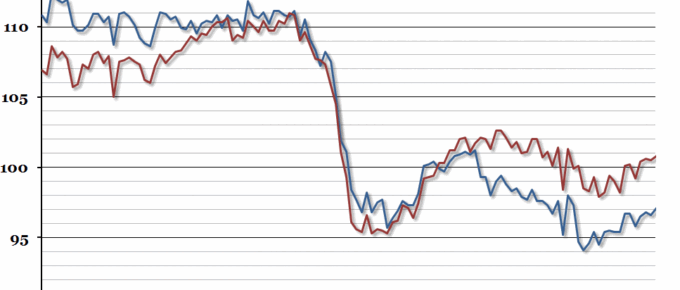
Chart of the Week: Week 7, 2014: UK Production Index
At the end of last week, the Office for National Statistics released the output of the production industries for December 2013.
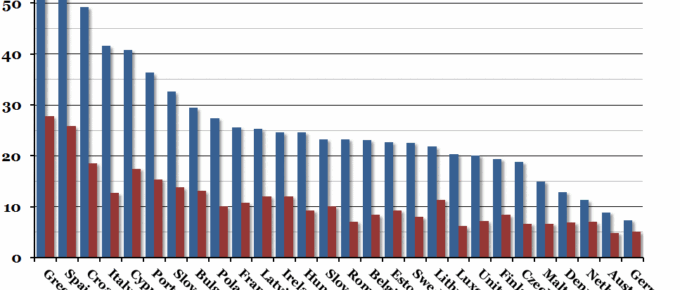
Chart of the Week: Week 6, 2014: EU Unemployment Comparison
Eurostat released the European Union’s latest unemployment statistics at the end of last week, and they showed an overall rate of 12% in December 2013, compared to 11.9% in December 2012.

