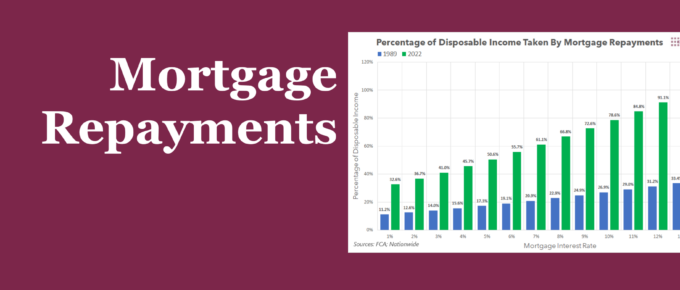
Summary When faced with the prospect of rising interest rates, some have dismissed the potential pain it will cause by arguing that rates were much higher in the 80s and 90s. This week’s chart compares the impact on living standards that high mortgage rates had on homeowners in the late 80s to the present day, […]
Chart of the Week
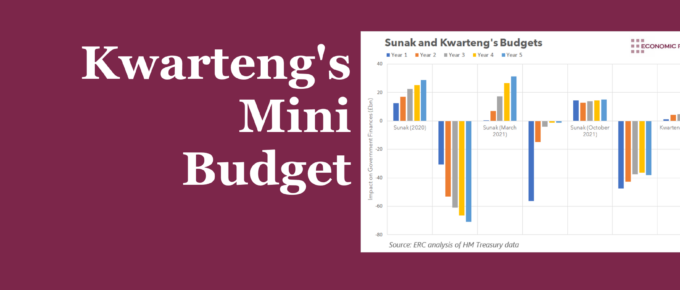
Summary Kwasi Kwarteng announced a range of fiscal measures, which set a clear tone for what we are likely to see from the current government. These measures largely consisted of tax cuts. Whilst they are likely to hurt government finances, their announcement clearly shows the priority that this government places on supply-side policies. What does […]
Chart of the Week
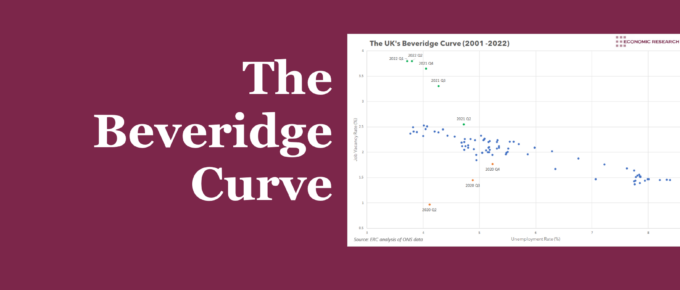
Prior to the pandemic, a clear negative relationship existed between vacancies and unemployment. The experience of 2020 challenged this relationship and seemed to indicate labour market inefficiencies.
Chart of the Week
This year has seen rising fuel prices across all of Europe, however, countries have not been united in their approach to dealing with it.
Chart of the Week
Fine particles and pollutants in the air resulting from human activity negatively impact our wellbeing, the NHS, and inadvertently the economy.
Chart of the Week
Summary The number of people employed by the civil service ballooned after the Brexit vote, reversing a long-term trend of declining staff numbers. However, not all grades were affected equally. Proposed reductions in the number of civil servants must take into account the story of the last ten years to ensure the provision of public […]


