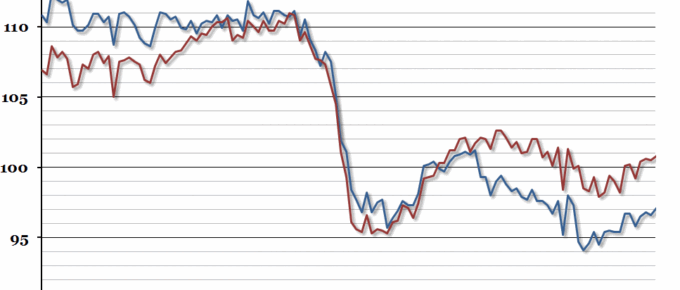
At the end of last week, the Office for National Statistics released the output of the production industries for December 2013.
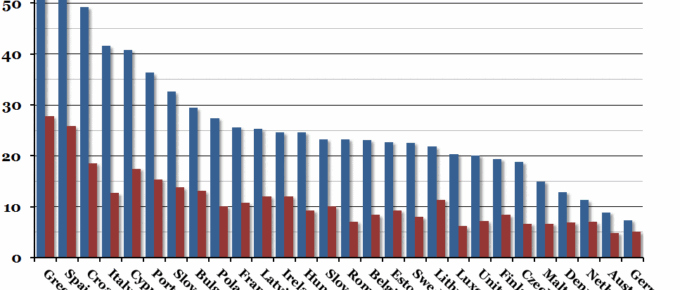
Chart of the Week: Week 6, 2014: EU Unemployment Comparison
Eurostat released the European Union’s latest unemployment statistics at the end of last week, and they showed an overall rate of 12% in December 2013, compared to 11.9% in December 2012.
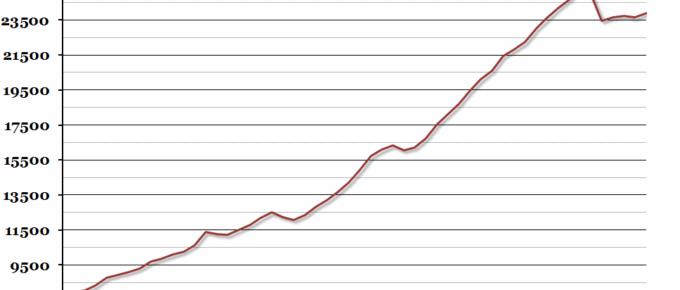
Chart of the Week: Week 5, 2014: UK GDP Per Capita
Encouraging GDP figures were released this week, showing that growth in the final quarter of 2013 was 0.7% on the previous quarter, and annual growth for 2013 was 1.9%.
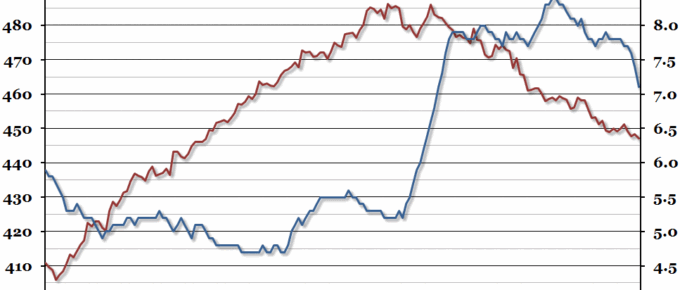
Chart of the Week: Week 4, 2014: Unemployment and Earnings
The monthly labour market statistics brought further good news this week as the unemployment rate fell to 7.1% in the three months leading up to November 2013.
Chart of the Week: Week 3, 2014: Inflation Hits 2% Target
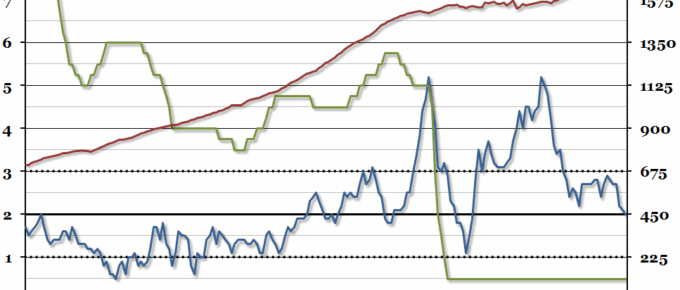
The CPI measure of inflation hit the Bank of England’s 2% target this week for the first time since November 2009.
Chart of the Week: Week 2, 2014: European Bond Yields
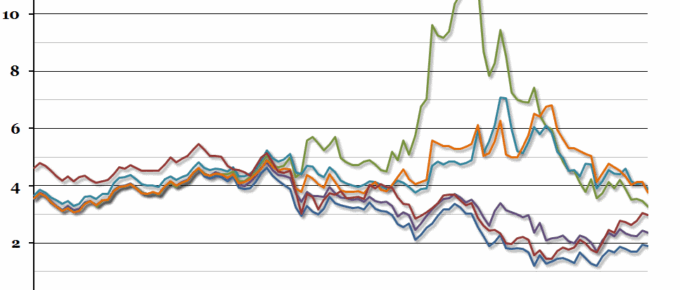
A lot has been happening in the European bond yield markets this week, as a recent (successful) sale of bonds by the Irish government gave a boost to borrowing rates across Europe, and the gap between UK and German bond yields increased to the largest it has been since 2005.

