Summary
The Land Registry published their data on average house prices for April recently, and they showed that although the average price grew by just over 5% in nominal terms, this was the slowest annual growth rate since January 2014. As usual with the housing market, there are vast regional differences, with London continuing to grow by almost 11% annually, while in the North East of England prices are falling slightly.
What does the chart show?
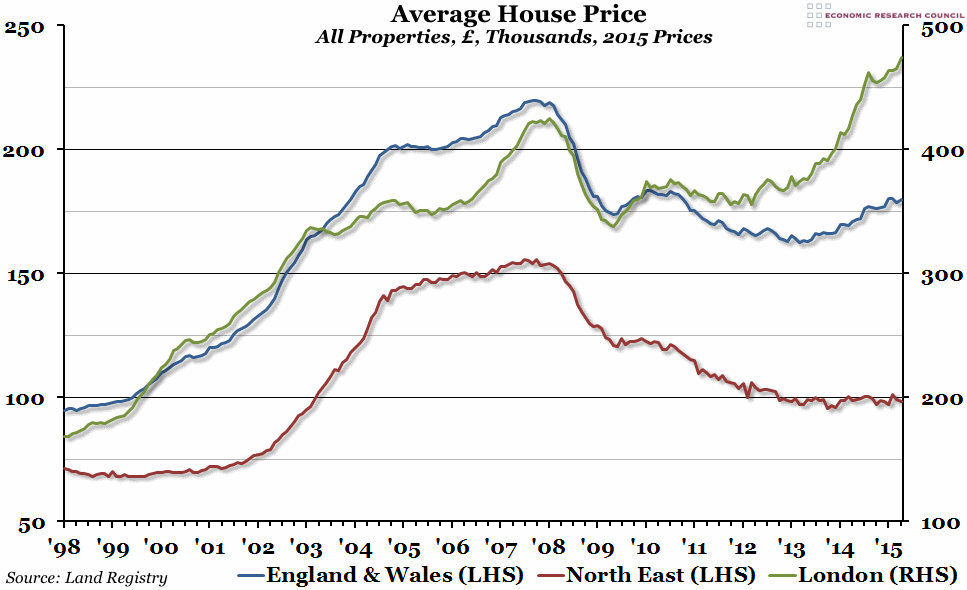
The chart shows monthly average house prices, by region, as reported by the Land Registry, in thousands of pounds and adjusted for inflation (i.e. in 2015 prices). The average prices are calculated using a database consisting of all residential property transactions across England and Wales, standardising price changes based on repeat sales. The blue line represents the average house price in the whole of England and Wales, the red line just in the North East region (both measured against the left hand axis), and the green line in London (measured against the right hand axis).
Why is the chart interesting?
Looking at the movement in the average house price in real terms (as we’ve done here) is slightly less impressive than in nominal terms, but nevertheless shows significant growth in the real value of housing in the UK over the last 15-20 years. Even in the very short term, growth has been strong, but it looks like the rate of growth has been slowing down in the past few months.
The regional differences are obvious on this graph. From 1998 to 2010, real house prices in London have generally been roughly twice the national average (apart from a brief split in 2003/04, when growth in London slowed slightly and took a while to catch back up), which is why we’ve had to put London prices on a separate axis. However, since 2010 there has been a significant decoupling, with London house prices growing much faster than the rest of the country, so that the London average is now over 2.5 times the national average (and has overtaken the previous peak in late 2007, which the national average is still yet to do). Meanwhile, prices in the North East of England have remained steady (in real terms) for over three years, and are only two-thirds of their 2008 peak.
If you’d like to find out more about the performance of the UK residential property market, come along to the ERC’s Third Annual “Boom or Bust” Property Discussion next week, where you’ll get a chance to put your questions to a panel of property experts. For more information, and to book tickets (which range from £5 – £15), please click here.

