While Brexit will progress, it is at least beginning to become less topical, which means that business decisions are being taken and business leaders are getting on with dealing with the issues of delivery of goods and services and expanding their companies’ capacities to meet growing demand…
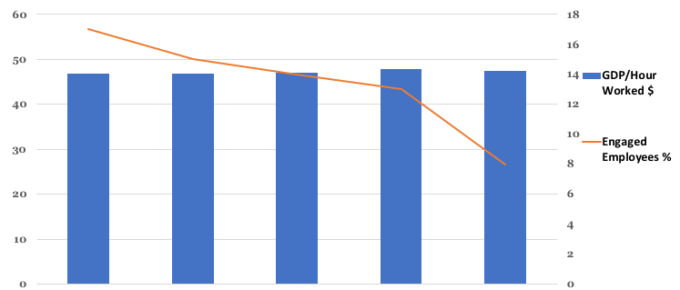
Chart of the Week: Week 4, 2018: GDP per Hour Worked v.s. Employee Engagement
The chart shows that just 8% of UK employees are enthused about their work and work environment in 2016. This represents a fall from 17% in 2012. The chart …
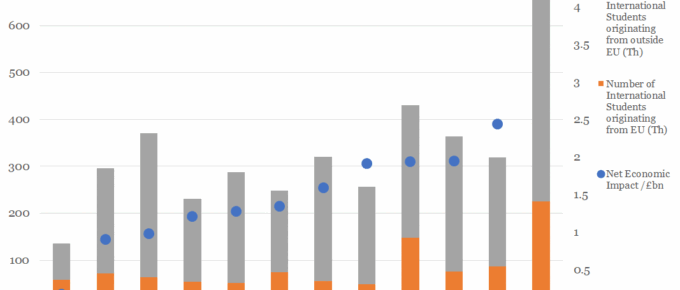
Chart of the Week: Week 2, 2018: International Students’ Economic Impact by Region
The chart shows the economic impact of the 2015/16 cohort of international students, who on average, contribute £1.7bn to each region displayed. Of the international students in this cohort, an average of 25% originate…
September 2017
It’s difficult not to worry about Europe and Brexit where, on the one side twenty-seven governments, particularly when they are led by recalcitrant Brussels bureaucracy, are unlikely to be able to unanimously…
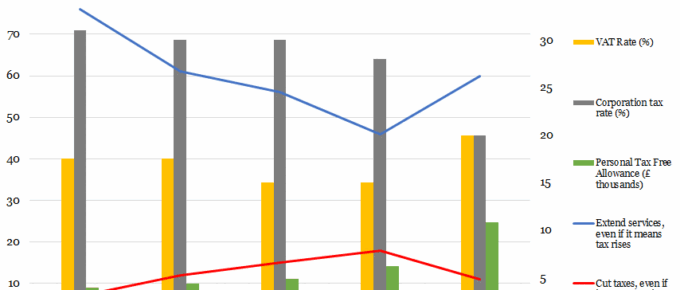
Chart of the Week: Week 34, 2017: Historical Support for Tax Rises v.s. Corporation tax, VAT and Personal Allowance
The chart shows that support for the raising of taxes to extend public services had been waning steadily between 1997 and 2009.
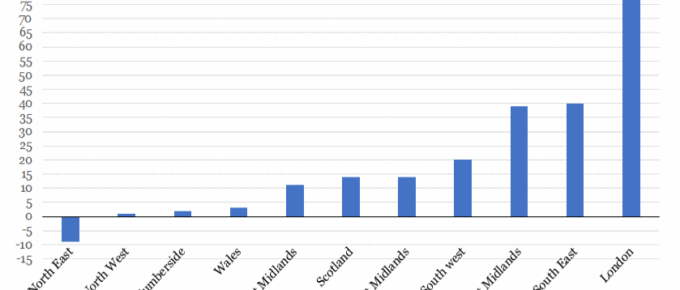
Chart of the Week: Week 33, 2017: UK Houseprice Growth since the Financial Crash
This chart shows that London house price growth over the last decade has far outstripped all other regions in the UK, with areas of staggering growth such as Hackney, which rose 120%.


