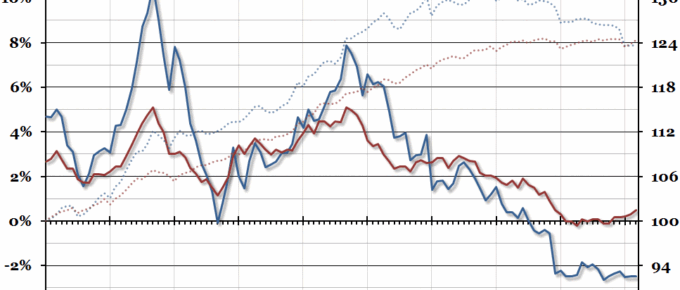
The official CPI measure of inflation picked up in March to +0.5% on the previous year.
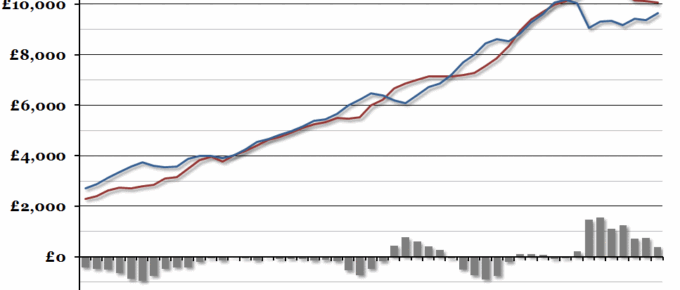
Chart of the Week: Week 14, 2016: UK Household Spending
A large quantity of statistics relating to the final quarter of last year were released at the end of last week, and one interesting aspect was that real per capita household spending in 2015 almost returned to the 2007 peak.
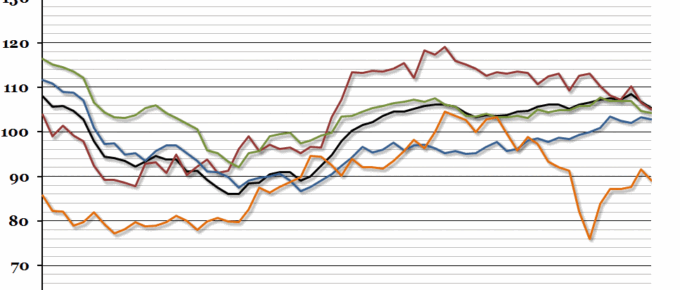
Chart of the Week: Week 12, 2016: Economic Confidence
This week marks the fifth anniversary of the Economic Research Council’s Chart of the Week.
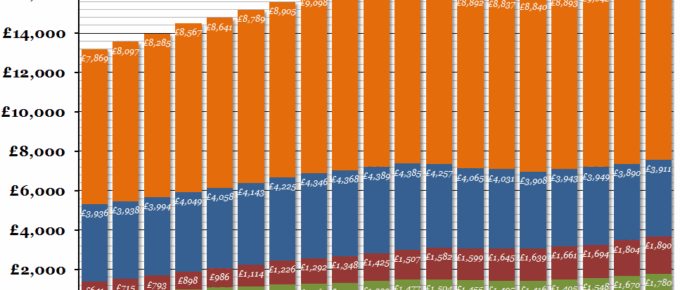
Chart of the Week: Week 11, 2016: UK Central Government Finances
We’ve updated our annual chart on central government finances per person in time for this afternoon’s UK Budget speech.
Chart of the Week: Week 10, 2016: UK Interest Rate
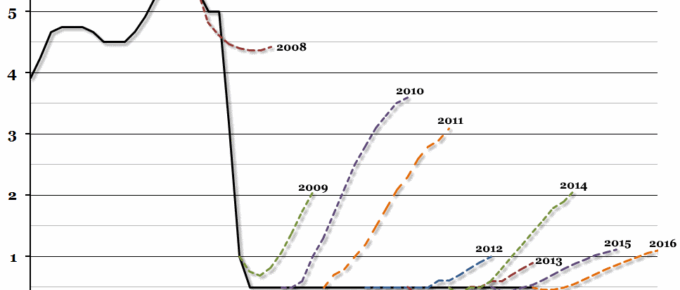
Saturday marked the seventh anniversary of the Bank of England’s introduction of the emergency 0.5% Bank Rate.
Chart of the Week: Week 9, 2016: EU GDP Per Capita
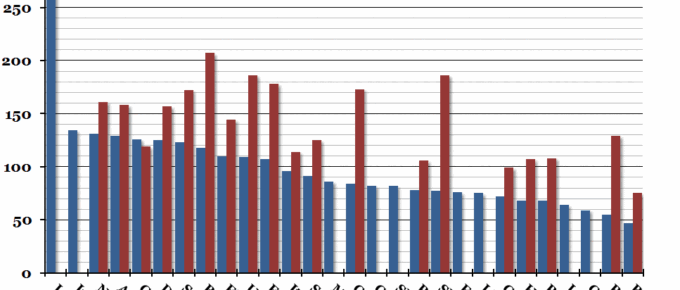
At the end of last week, Eurostat released a report on regional GDP per capita across the EU.

