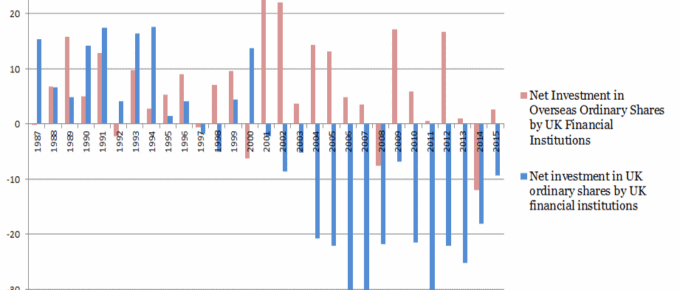
The chart shows that the year 2000 marked a turning point in financial institutions’ strategy, turning their focus to shares in international companies and away from investment in UK business.
Chart of the Week: Week 39, 2016: Impact of Brexit on the Big 4 UK Banks
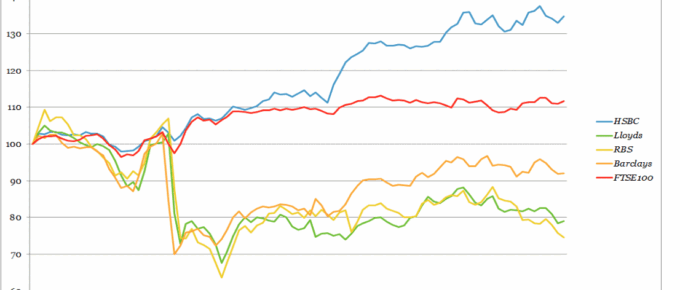
After the collective downturn following the Brexit vote in June (a dramatic 30%), RBS, Lloyds and Barclays share prices have remained well below their pre-referendum rates.
September 2016
Like a drug, increasing QE is less and less effective. The actions of the Bank of England post-Brexit are for this reason extremely worrying and will cause many more problems down the road for banking…
Chart of the Week: Week 35, 2016: Crime and the Economy
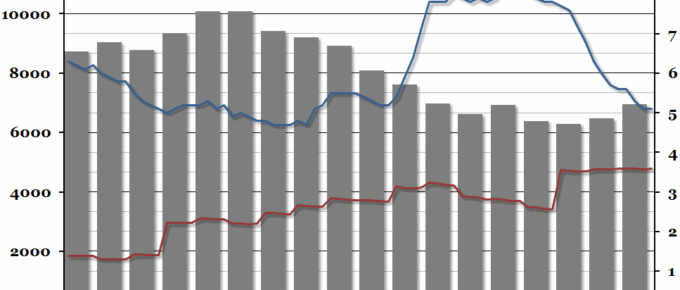
Despite the experience of the 1980s when crime rose sharply with unemployment, crime rates in the UK have remained static post the financial crisis despite large fluctuations in unemployment.
Chart of the Week: Week 33, 2016: Price of Gold vs. Equities
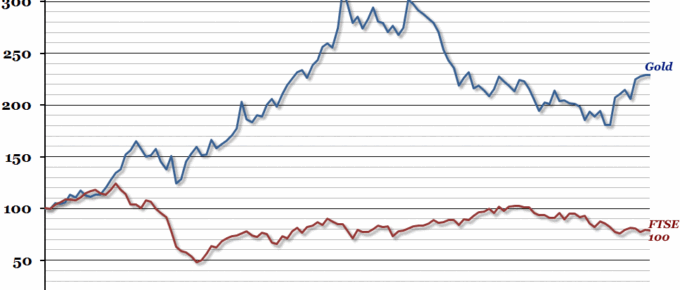
Had they invested in August 2006, investors in Gold have would have received a return of over 100%, whereas investors in UK equities (as measured by the FTSE 100) would have received less than their initial investment.
Chart of the Week: Week 32, 2016: UK Private Rent inflation
Over the past 5 years, rental prices in the UK on average have remained broadly stable.

