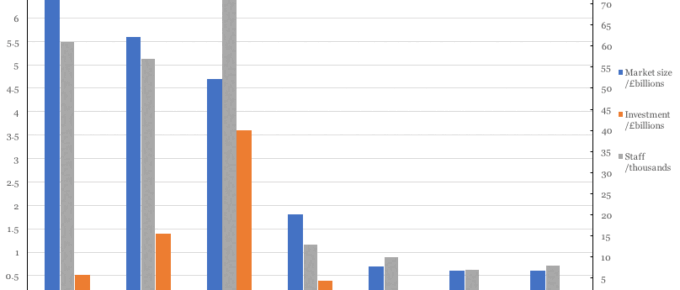
The FinTech industry in London and in New York clearly benefit from their proximity to global banking centres although London commands the lion’s share of the market, estimated to be £6.6 billion.
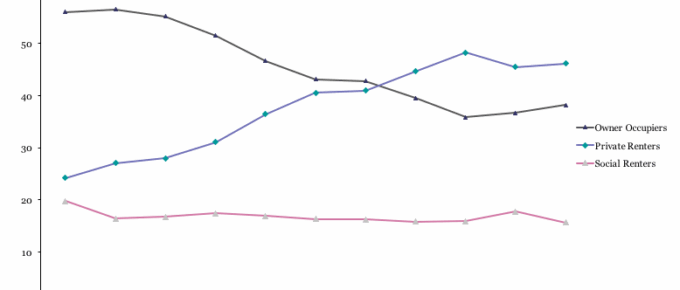
Chart of the Week: Week 17, 2017: Households of 25-34 year-olds by Tenure
The chart shows that 2011/12 marked the point that home-owning 25-34 year olds were no longer in the majority, surpassed by those that rent privately.
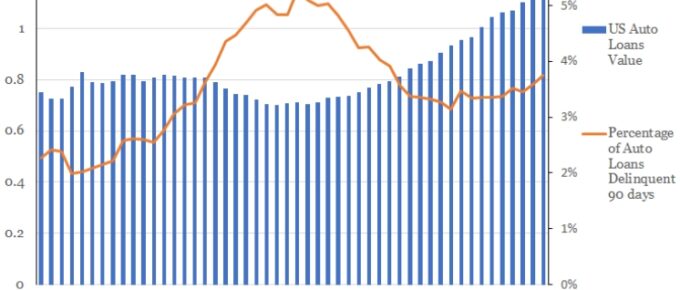
Chart of the Week: Week 16, 2017: US Car Loan Delinquency
US car manufacturers are increasingly using in-house financing.
They are also increasingly taking on riskier clients.
Donate to the ERC
If the page below doesn’t work, you can donate via PayPal by clicking here.
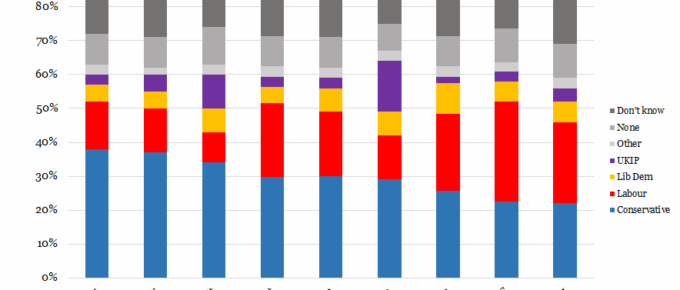
Chart of the Week: Week 15, 2017: UK Voter Sentiment on Key Issues
The chart shows that the Conservative Party enjoys the majority of support across 7 of 9 issues, with Labour support exceeding the Tories’ only on NHS and Housing.
Chart of the Week: Week 14, 2017: Trends in Take-Home Pay
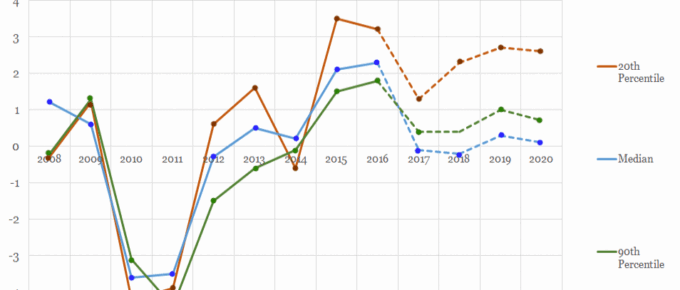
The chart shows that take home wages for the 2nd and 9th decile of earners have been strongly correlated in the years since the financial crisis.

