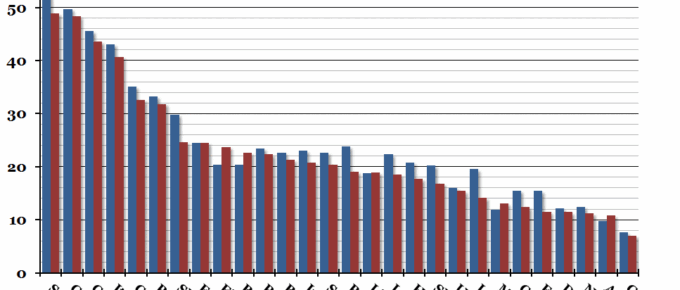
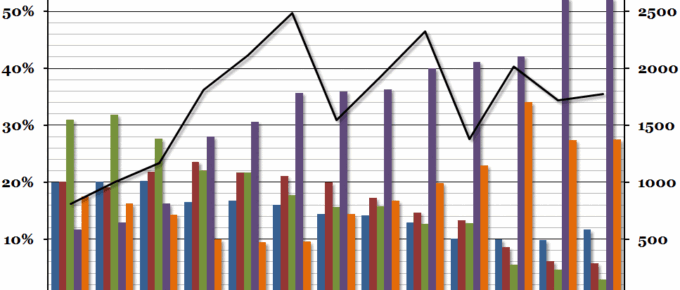
European unemployment figures were released by Eurostat this morning, and showed a continuation of the downward trend in the aggregate EU unemployment rate.
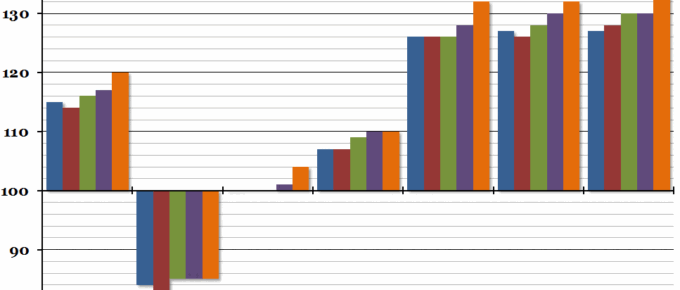
Chart of the Week: Week 38, 2015: International Comparison of Productivity
At the end of last week, the Office for National Statistics released their annual international comparison of productivity for 2014, and it showed that although the UK’s productivity increased very slightly, our relative position within the G7 worsened to the lowest point on record.
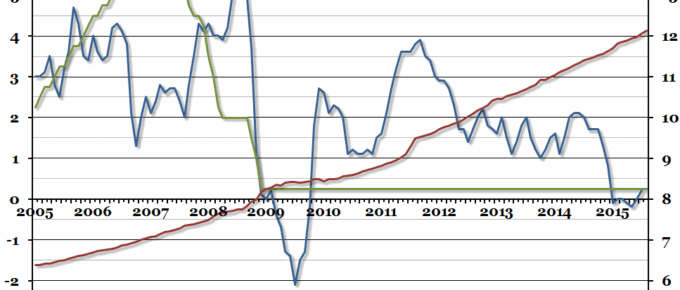
Chart of the Week: Week 37, 2015: US Monetary History
The US Federal Reserve are meeting today and tomorrow to discuss monetary policy, and whether they will raise the Federal Funds Target Rate which has been at 0%-0.25% since 2009.
Chart of the Week: Week 36, 2015: UK Trade Balance
UK trade figures out this morning showed that despite a poor month of trading in July, the trade deficit almost halved between the quarter to April and the quarter to July (from £8.9bn to £4.7bn) after a strong summer for UK trade generally.
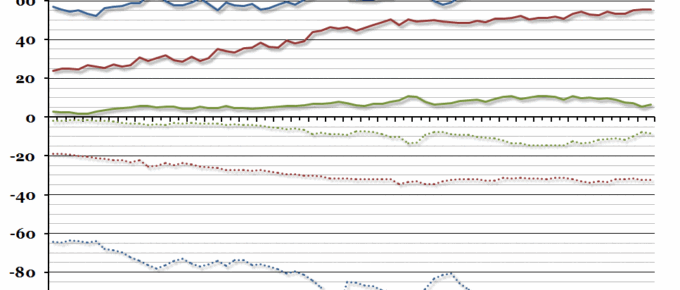
Chart of the Week: Week 35, 2015: Ownership of UK Shares
The latest figures for UK share ownership were released this morning, and they showed that foreign investors still own more than half of the value of all UK shares.
Chart of the Week: Week 34, 2015: Global Stock Markets
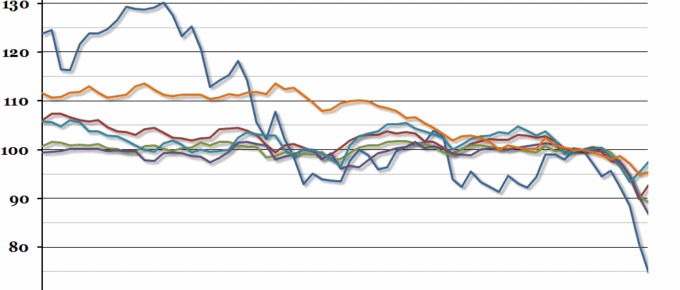
Since our chart on Chinese exchange rates last week, the global economic press has shifted focus from the currency to the stock markets.

